


echo 200, echo 300c, echo 500c, and echo 550c Owner’s Manual 7
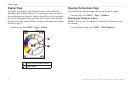
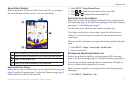
Viewing Pages
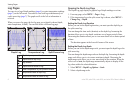
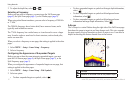
The Temperature Log page displays a graphic log of water temperature
readings over time.
1. From any page, select MENU > Pages > Log.
2. If the temperature log or the split screen log is shown, select MENU >
Change Log > Temperature.
Before you can set the temperature log duration, you must open the
temperature log (page 7) or the split screen log (page 7).
You can change the time scale on the water temperature log. Increasing the
time scale allows you to view temperature variations over a longer period of
time. Decreasing the time scale allows you to view more detail over a shorter
period of time.
1. Select MENU > Temp. Log Options > Duration.
2. Select a duration.
Before you can set the temperature-range scale, you must open the
temperature log (page 7) or the split screen log (page 7).
You can change the temperature-range scale on the temperature log.
Increasing the temperature-range scale allows you to view more variations
in temperature. Decreasing the temperature-range scale allows you to view
more detail in the variation. When the scale is set to Auto, the temperature
range automatically adjusts to display all the log values within the selected
duration.
1. Select MENU > Temp. Log Options > Scale.
2. Select a temperature-range scale.
You can view the depth log and temperature log simultaneously on the split
screen log. You can adjust the depth log duration (page 6), the depth log
scale (page 6), the temperature log duration (page 7), or the temperature log
scale (page 7) from this screen.
1. From any page, select MENU > Pages > Log.
2. If the temperature log or the depth log is shown, select MENU > Change
Log > Both.