


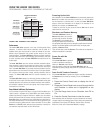
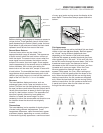
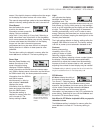
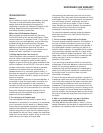
Sloped Bottoms
Bottoms having a large degree of slope also present a
unique picture. These generally have a thicker black
band representing the bottom directly under the boat.
Equal areas of gray above and below the black band
represent sonar returns from around the boat.
Second Sonar Returns
A second sonar return may be visible if the
appropriate depth range is selected. This appears as
a depth contour below the main bottom contour, at
twice the depth. The second return occurs when the
sonar signal bounces between the bottom and the
surface of the water, then back again. Some anglers
use the appearance of the second return to determine
bottom hardness. With a lower gain setting the
second return will be more faint, except in areas with
a hard bottom.
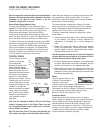
The L
EGEND
1000 S
ERIES
has a unique depth
range feature which permits the second return to be
visible in any depth range up to one-half the maximum
depth of the unit. See
M
ODES OF
O
PERATION
for details.
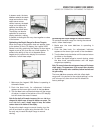
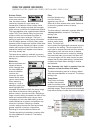
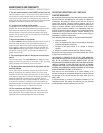
Structure
The LEGEND 1000 SERIES displays structure, such as
submerged grass, brush, trees and wrecks on the
bottom. Structure can be distinguished by comparing
the area just above and below the main bottom return.
Usually structure shows as areas of dark to light gray
on top of a dark bottom contour. The appearance of
structure is greatly affected by boat speed and
direction; to repeat the same image it is often
necessary to travel the same speed and direction over
the location where the structure was originally
located.
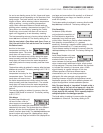
Thermoclines
The LEGEND 1000 SERIES is also capable of showing layers
of water having different temperatures. These
temperature differences, called thermoclines, appear
at different depths, depending on current conditions.
A thermocline typically appears as a continuous band
of many gray levels moving across the display at the
same depth. Thermoclines always appear above the
bottom.
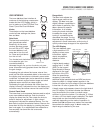
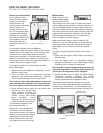
Fish Appearance
Schools of bait fish as well as individual fish are clearly
visible on the L
EGEND
1000 S
ERIES
display. Bait fish appear
as “clouds” having different shapes and sizes
depending on the number of fish and boat speed.
Individual fish appear as smaller black and gray lines,
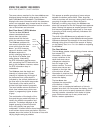
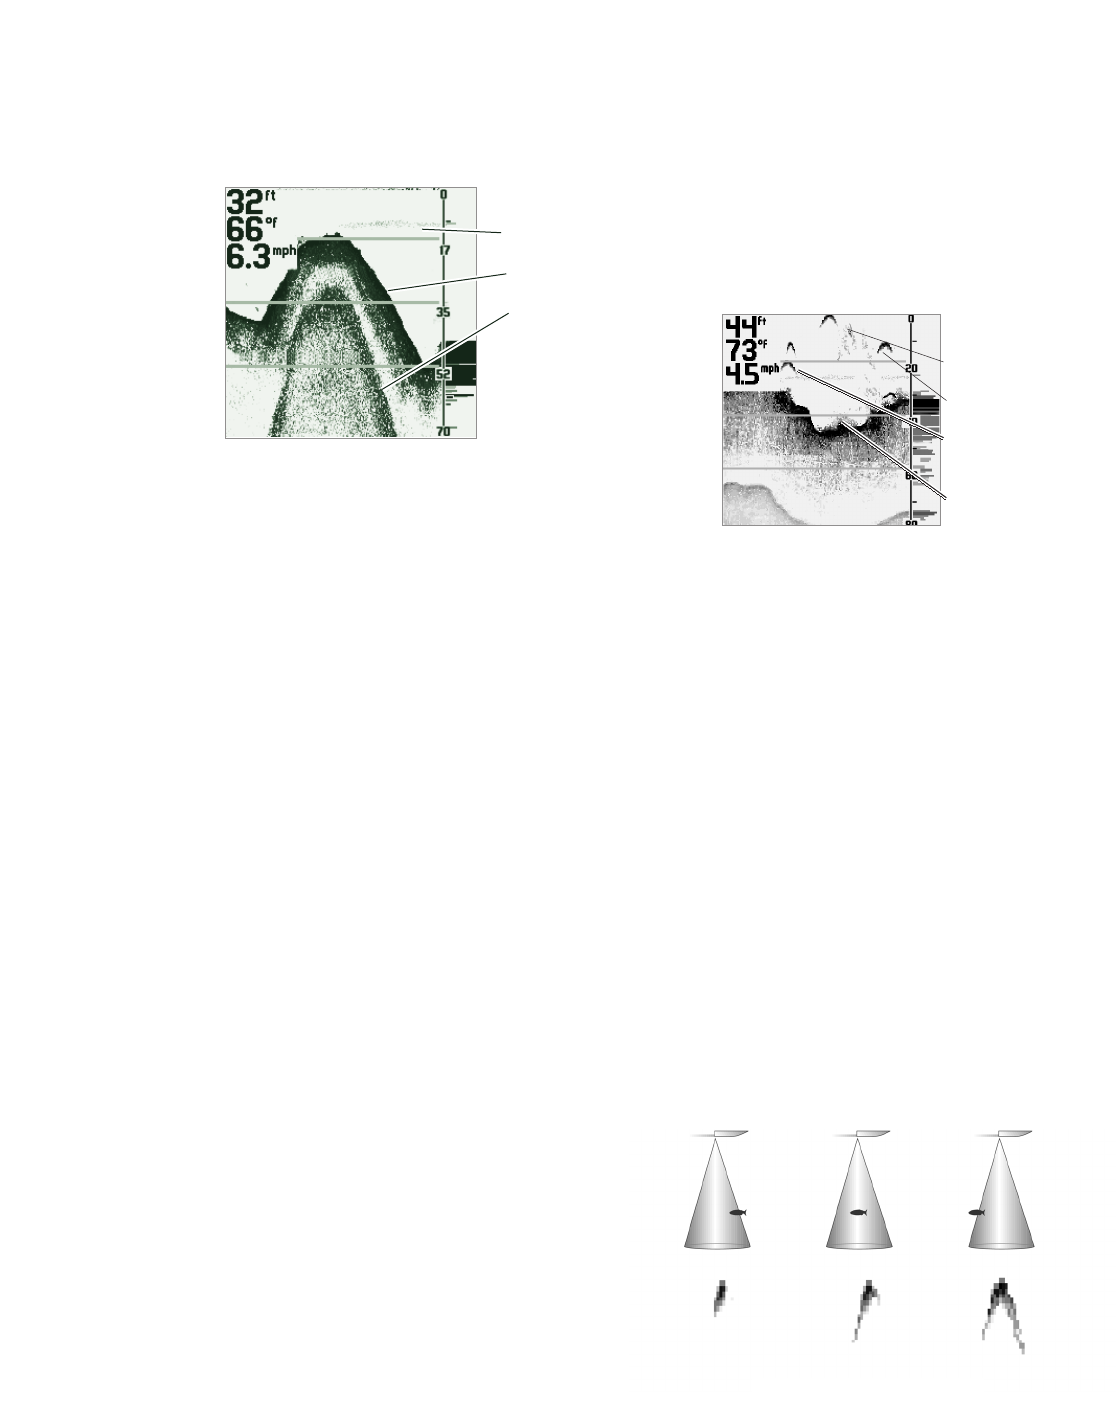
often appearing as a “fish arch.”
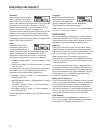
A fish arch may form
as the fish moves through the sonar beam. Due to the
transducer beam angle, the distance to the fish
decreases as the fish moves into the beam, and then
increases as it moves out again. When the CHART
WINDOW graphs this distance change, an arch
appears. Boat speed, the CHART SPEED setting and
movement of the fish greatly affect the shape of the
arch. When the boat and the fish are moving slowly
relative to each other, the fish creates an elongated
arch. When the boat and the fish are moving quickly
relative to each other, the fish creates a shorter arch.
A partial arch forms when the fish does not move
through the entire cone angle.
5
USING THE LEGEND 1000 SERIES
CHART WINDOW / BOTTOMS / FISH APPEARANCE
Thermocline
Slope
Second Return
Bait fish
Fish Arch
Partial Fish
Arch
Structure
Fish Arch Diagram