


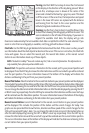

18
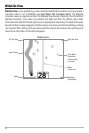
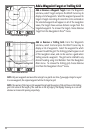
Panning: Use the 4-WAY Cursor keys to move the chart around
on the display in the direction of the key being pressed. When
you do this, a bullseye cursor is drawn at the center of the
screen and is linked to the boat by a gray line, even if the boat
is off the screen. At the same time, the temperature and speed
boxes in the lower left corner are replaced with the distance
and bearing from the boat to the cursor position and the
latitude/longitude coordinates of the cursor.
Zooming: Use the Plus (+) key to Zoom In and the Minus (-) key
to Zoom Out showing the cartography at different scales. The
scale is indicated on the left side of the display. If you zoom in
beyond the available chart data, the display will go into
Overzoom mode whereby the last available chart data is amplified to reflect the scale selected. If you
zoom in so far that no cartography is available, a lat/long grid will be drawn instead.
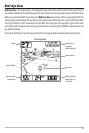
Chart Info: Use the INFO key to get detailed information about the chart. If the cursor is active, you will
see information about the chart objects located near the cursor. If the cursor is not active, the Chart Info
menu will appear. You can select the nearest port, the nearest tide station, or the nearest current
station to see information about any of these objects.
NOTE: The built-in UniMap™ does not contain any Port, Tide or Current information. This information is
only available from optional-purchase MMC cards.
Nearest Port: The position and services information for the nearest port to your present position will
be displayed. Press the EXIT key to remove the information box and the cursor bull’s eye will be centered
over the port position. The cursor information boxes at the bottom of the display will indicate the
distance and bearing to the port from your present position.
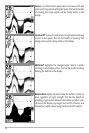
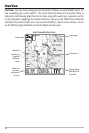
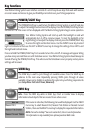
Nearest Tide Station: Tide information for the nearest tide station to your present position will be displayed.
This includes the position of the station and the times of the high and low tides for today’s date. A tide graph
is also displayed showing the rise and fall of the tides for the 24 hour time period encompassing the date.
You can change the date to look at tide information before or after the date displayed by pressing the LEFT
or RIGHT cursor key respectively. Press the EXIT key to remove the information box and the cursor bull’s eye
will be centered over the tide station position. The cursor information boxes at the bottom of the display
will indicate the distance and bearing to the tide station from your present position.
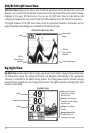
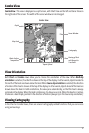
Nearest Current Station: Current information for the nearest current station to your present position
will be displayed. This includes the position of the station and the current changes for today. Two
graphs are also presented that show the time, direction and flow speed of the current changes for the
24 hour time period of today’s date. You can change the date to look at current information before or
after the date displayed by pressing the LEFT or RIGHT cursor key respectively. Press the EXIT key to
remove the information box and the cursor bull’s eye will be centered over the current station position.
The cursor information boxes at the bottom of the display will indicate the distance and bearing to the
current station from your present position.
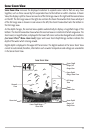
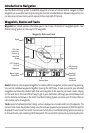
Chart View with Cursor Present