


8
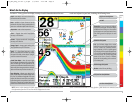
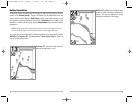
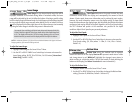
Sonar Zoom View
Sonar Zoom View increases the displayed resolution to separate sonar returns that are
very close together, such as those caused by fish suspended close to the bottom or within
structure. In Zoom View, the display is split to show a narrow slice of the full range view
on the right and the zoomed view on the left. The full range view on the right also
contains the Zoom Preview Box that shows what part of the full range view is shown in
zoom view on the left; the Zoom Preview Box tracks the bottom in the full range view.
As the depth changes, the zoomed view updates automatically to display a
magnified image of the bottom. The Zoom Preview Box shows where the zoomed
view is in relation to the full range view. The Zoom Level, or magnification, is
displayed in the lower left corner and can be changed to suit conditions (see Sonar
X-Press™ Menu: Zoom Level). Upper and Lower Zoom Depth Range numbers indicate
the depth of the water which is being viewed.
Digital depth is displayed in the upper left hand corner. The digital readouts in the
Sonar Zoom View cannot be customized; therefore, information such as water
temperature and voltage are unavailable in the Sonar Zoom View.
Sonar Zoom View
Full Range View
Upper Depth Range,
Full Range View
Lower Depth Range, Zoom View
Lower Depth Range,
Full Range View
Zoomed
View
Zoom
Preview Box
Zoom Level
Depth
Upper Depth Range,
Zoom View
7
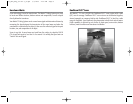
Understanding Sonar History
It is important to understand the significance of the Matrix™ Fishing System display.
The display does NOT show a literal 3-dimensional representation of what is under
the water. Each vertical band of data received by the control head and plotted on the
display represents something that was detected by a sonar return at a particular
time. As both the boat and the targets (fish) may be moving, the returns are only
showing a particular segment of time when objects were detected, not exactly
where those objects are in relation to other objects shown on the display.
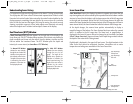
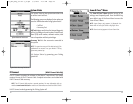
Real Time Sonar (RTS®) Window
A Real Time Sonar (RTS®) Window appears on the right side of the display in the
Sonar View only. The RTS® Window always updates at the fastest rate possible for
depth conditions and shows only the returns from the bottom, structure and fish
that are within the transducer beam. The RTS® Window plots the depth and
intensity of a sonar return (see Sonar Menu - RTS® Window).
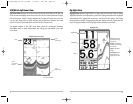
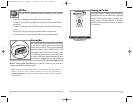
The Narrow RTS® Window
indicates the sonar intensity
through the use of colors. Red
indicates a strong return and
blue indicates a weak return.
The depth of the sonar return
is indicated by the vertical
placement of the return on
the display depth scale.
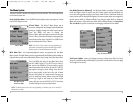
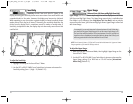
The Wide RTS® Window
indicates the sonar intensity
through the use of a bar
graph. The length of the
plotted return provides an
indication of whether the
return is weak or strong. The
depth of the sonar return is
indicated by the vertical
placement of the return on
the display depth scale.
M77_Man_Eng_531350-1_B.qxd 1/3/2005 4:29 PM Page 12