


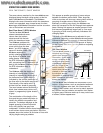

The sonar returns received by the LEGEND 2000 SERIES are
displayed along the depth range scale in a REAL TIME
SONAR™ (RTS) WINDOW and CHART WINDOW. The RTS WINDOW
displays new sonar information within the transducer
cone in an expanded, easy-to-see format; the CHART
WINDOW logs old RTS WINDOW information to show a contour
view of the bottom and structure.
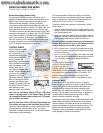
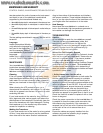
Real Time Sonar™ (RTS) Window
The REAL TIME SONAR (RTS) WINDOW
shows instantaneous sonar
returns from the bottom,
structure and fish that are
within the transducer beam.
The RTS WINDOW updates with
new sonar information much
more quickly than the CHART
WINDOW - up to 20 times per
second in shallow water. The
RTS WINDOW responds to
quickly-changing depths in a
way similar to a flasher type
sonar display. Interpreting
the RTS information requires some
skill; comparing the RTS data with the
data in the CHART WINDOW, however, makes
the RTS information easy to
understand.
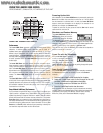
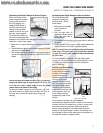
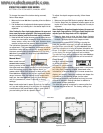
The RTS WINDOW plots the depth and
intensity of a sonar return. Sonar
intensity is indicated by the length of
the horizontal lines, while depth is
indicated by the vertical placement of
the lines next to the depth range scale.
The intensity of the sonar return is
divided into four levels of grayscale.
The most intense returns are shown in
black; less intense sonar returns are
shown in progressively lighter shades
of gray.
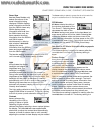
The combination of the length of the
lines and the gray scale level helps to
identify the bottom composition and
structure. The bottom displays as the
largest grouping of black horizontal
lines, and typically has gray lines
underneath. A harder bottom shows less gray below;
a soft bottom shows more gray below. Structure
appears above the bottom as a cluster of lines with
varying lengths and gray shades.
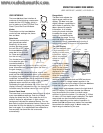
Fish appear as smaller groupings of sonar returns
between the bottom and surface. Often, large fish
within a structure will show as a strong return within a
grouping of smaller returns. When the boat is
stationary or drifting very slowly, the RTS WINDOW can
show the movement of the fish through the transducer
beam. Moving fish appear as smaller groups of lines
that become progressively larger lines, or vice versa.
A grouping of lines moving vertically indicates a fish
changing depth.
The width of the RTS WINDOW can be adjusted to your
preference. Selecting a wider RTS WINDOW shows greater
differences between the strength of the sonar returns,
although doing this will reduce the amount of history
on the display. See CONTROL PANELS for details on adjusting
the RTS WINDOW.
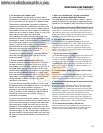
The Chart Window
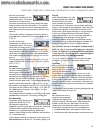
The CHART WINDOW creates a
historical log of sonar
returns from stored RTS
information. As the boat
moves, variations in the
depth and sonar return
changes are charted to
form an image of the
bottom contour. The most
recent sonar returns are
charted on the right side of
the window; as new
information is received, the
older information is moved
across the display.
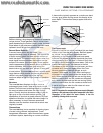
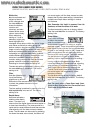
The CHART WINDOW also indicates the composition of the
bottom. A hard bottom, such as compacted sediment
or flat rock, appears as a dark, thin line across the
display. A soft bottom, such as mud or sand, appears
as a thicker line that contains a transition from darker
to lighter grays. Bottoms made up of many rocks have
a broken, random appearance.
4
USING THE LEGEND 2000 SERIES
REAL TIME SONAR™ / CHART WINDOW
Hard
Bottom
Soft
Bottom
Rocky
Bottom
Chart Window
Intense
returns
Less intense
returns
Structure
Bottom
Fish
Soft
Bottom
Hard
Bottom