


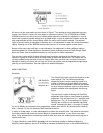
WHAT YOU SEE ON-SCREEN
Your Tour Series uses a 64 x 128 matrix SuperTwist LCD display. This type of display provides
outstanding viewability in all light conditions over a wide range of temperatures.
The presentation of information on-screen may take one of several forms depending on the type of
transducer being used, whether or not the Temp/Speed sensor is connected, and the current setting of
various user options. See Advanced Operation for information on custom screen options.
NOTE: When in simulator mode, the word "simulator" occasionally scrolls across the display indicating
that the information onscreen is not real sonar data.
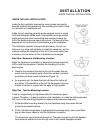
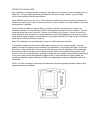
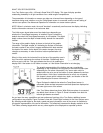
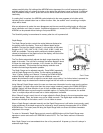
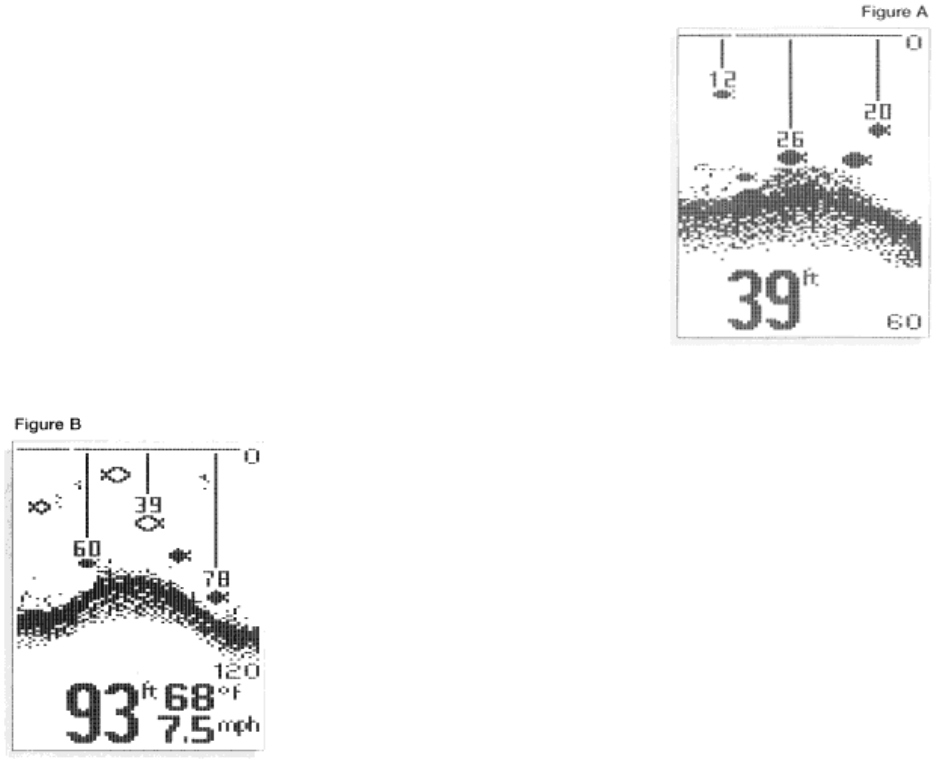
The initial screen layout takes one of two basic forms depending on
whether the Temp/Speed accessory is installed. Figure A shows the
default view when the Temp/Speed accessory is not installed. The digital
depth number shows the depth of water directly beneath the transducer
location.
The range of the graphic display is shown to the right of the graphic
information. The upper number is 0 indicating the surface of the water,
the lower number is one of the 9 ranges available which best matches
the depth of the water. As the depth of the water changes, the range
changes as necessary in order to retain a bottom representation on-
screen.
When in Auto mode, the horizontal line at the top of the graphics area is
the 0 line which represents the surface of the water. Occasionally there
will be a gap in this line. This gap indicates that the unit is updating the
display even if the bottom is not visible on-screen, or if the bottom information is not changing.
The graphic representation of the bottom may vary considerably
depending on the composition and regularity of the bottom surface (see
Interpreting the On-screen Information). Any sonar return which is
determined to be not a part of the bottom is shown between the surface
and the bottom. If this return is determined to be a fish, one of several
fish shapes is drawn which indicate size, depth, and location of the fish
(see Interpreting the Onscreen Information).
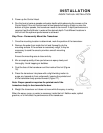
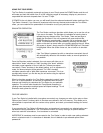
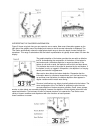
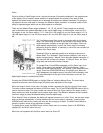
Figure B shows the default view when the Temp/Speed sensor is
connected. Water surface temperature and boat speed are displayed at
the lower right corner of the screen.
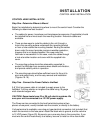
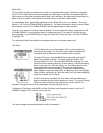
If the Tour Series determines that a Wide Side transducer is connected,
the default view is shown in Figure C. Sonar information from both the
left and right beams are shown.
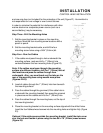
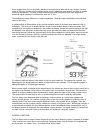
As you learn the many capabilities and user preference functions of the Tour Series, additional screen
configurations are possible. Figure D shows a view with "Small Digits" selected in the User Options menu.
By selecting smaller digits for the depth, speed and temp information, more of the screen is available for
the graphic representation of the sonar information. This effectively increases the display resolution of the
Tour Series, allowing targets which are very close together to be displayed as separate symbols.