


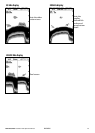
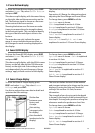
5-4 Sonar 83/200 display
To show the Sonar 83/200 display, press DISP
and select Sonar Tab, select Sonar 83/200
and press ENT.
This shows a split display, with the 83 kHz sonar
history on the left side and the 200 kHz sonar
history on the right side. Gain settings can be
set independently for each frequency. Range
settings apply to both sections of the display.
To change items, press MENU until the
Options menu is shown. Gain is explained
in section 4-4 Gain.
Range is explained in section 4-5 Range.
A-scope is explained in section 5-5 Sonar
A-Scope display.
Data header is explained in section 5-1
Sonar display.
Split ratio is explained in section 5-2
Sonar Zoom display.
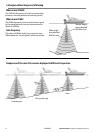
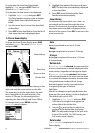
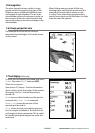
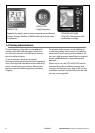
5-3 Sonar Bottom display
To show the Sonar Bottom display, press DISP
and select Sonar Tab, select Sonar Bottom
and press ENT.
This shows a split display, with the sonar history
on the right side and the zoom section on the
left. The bottom signal is shown as a flat trace
in the centre of the zoom section.
Showing the bottom as a flat trace can make
it easy to compare the echo strengths shown
in the bottom signals. This can help to identify
the type of bottom and objects close to the
bottom.
The zoom bar can only indicate the zoom
range. It cannot indicate the zoom offset as
this changes for each sounding displayed on
the display.
The zoom bar is fixed in the middle of the
display.
See section 4-5 Range, for information about
adjusting the Zoom Range and Zoom Offset.
To change items, press MENU until the
Options menu is shown.
Gain is explained in section 4-4 Gain.
Range is explained in section 4-5 Range.
A-scope is explained in section 5-5 Sonar
A-Scope display.
Data header is explained in section 5-1
Sonar display.
Bottom lock and Split ratio are
explained in section 5-2 Sonar Zoom display.
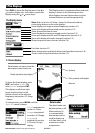
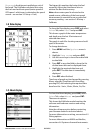
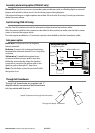
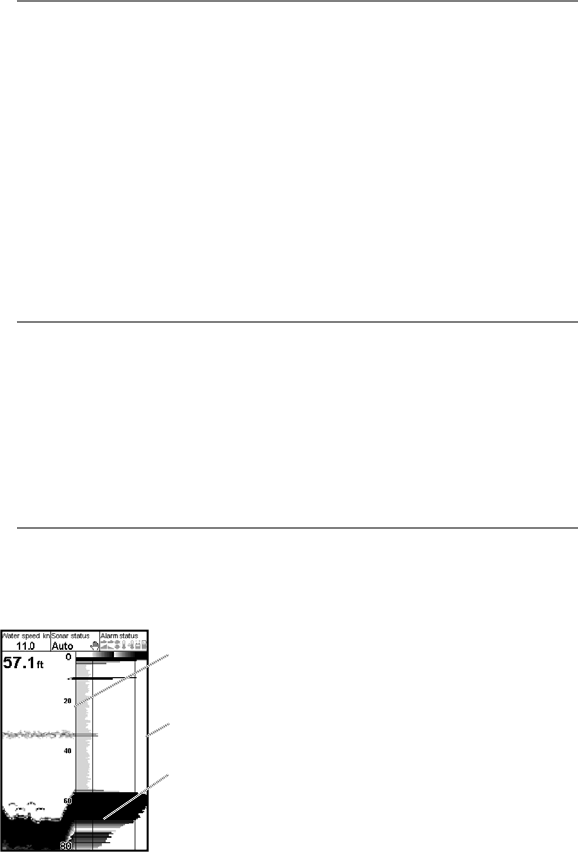
5-5 Sonar A-Scope display
The user can define the level of the weakest
and strongest echoes to be shown on the sonar
displays, by using the Gain and Threshold
settings. See section 4-4 Gain, for more
information.
The strength of an echo at a particular depth
is shown by the length of the horizontal line at
that depth. A strong echo produces a long line
whereas a weak echo produces a short line.
To change items, press MENU until the
Options menu is shown.
Gain is explained in section 4-4 Gain.
Range is explained in section 4-5 Range.
Data header is explained in section 5-1
Sonar display.
Split ratio is explained in section 5-2
Sonar Zoom display.
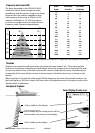
Divider line
between sonar
history and
A-scope
Gain setting
(strongest echo
for display)
Gain threshold
(weakest echo for
display)
To show the Sonar A-Scope display, press
DISP and select Sonar Tab, select Sonar
A-Scope and press ENT.
Use this to analyse the sonar data in detail and
optimize the Gain settings.
FISH 4432/4433 Installation and Operation Manual 26
NAVMAN