


71
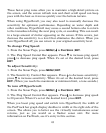
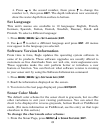
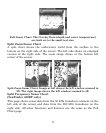
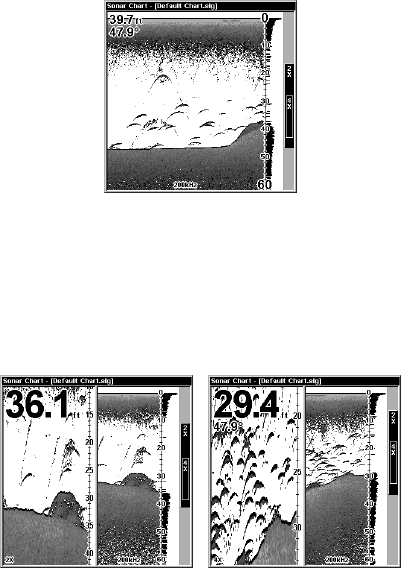
Full Sonar Chart. The Overlay Data (depth and water temperature)
are both set to the small text size.
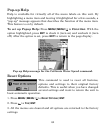
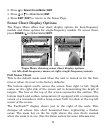
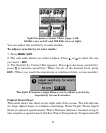
Split Zoom Sonar Chart
A split chart shows the underwater world from the surface to the
bottom on the right side of the screen. The left side shows an enlarged
version of the right side. The zoom range shows at the bottom left
corner of the screen.
Split Zoom Sonar Chart. Image at left shows the left window zoomed to
2X. The right image shows the left window zoomed to 4X.
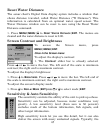
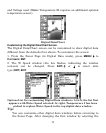
Split Frequency Sonar Chart
(SeaFinder 480DF only)
This page shows sonar data from the 50 kHz transducer element on the
left side of the screen and data from the 200 kHz transducer on the
right side. All other functions and features are the same as the Full
Chart page.