


1. OPERATION
12
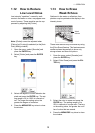
4. Select desired symbol and press the EN-
TER key. The size of the symbol is scaled
according to the estimated length of the
fish.
Note: To hide the fish symbol, select [Off]
at step 4 and press the ENTER key.
Note: You can select which frequency display
to show the fish symbols and fish information,
with [Symbols Area] on the [ACCU-FISH]
menu.
• [Dual]: Symbols and info shown on both HF
and LF displays.
• [HF]: Symbols and info shown on HF dis-
play.
• [LF]: Symbols and info shown on LF dis-
play.
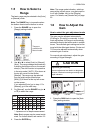
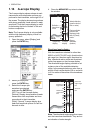
1.15.3 Fish info
1. Open the menu, select [Display] and
press the ENTER key.
2. Select [ACCU-FISH] and press the EN-
TER key to show the [ACCU-FISH] menu.
3. Select [Fish Info] and press the ENTER
key.
4. Use S or T to select [Off], [Fish Size] or
[Depth] as appropriate and press the EN-
TER key.
Note 1: You can show the fish info figure
alone (without fish symbol) by turning off
[Fish Symbols] on the [Display] menu.
Note 2: You can show the fish info in
small or large characters, with [Info Size]
on the [ACCU-FISH] menu.
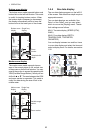
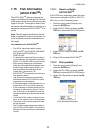
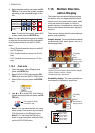
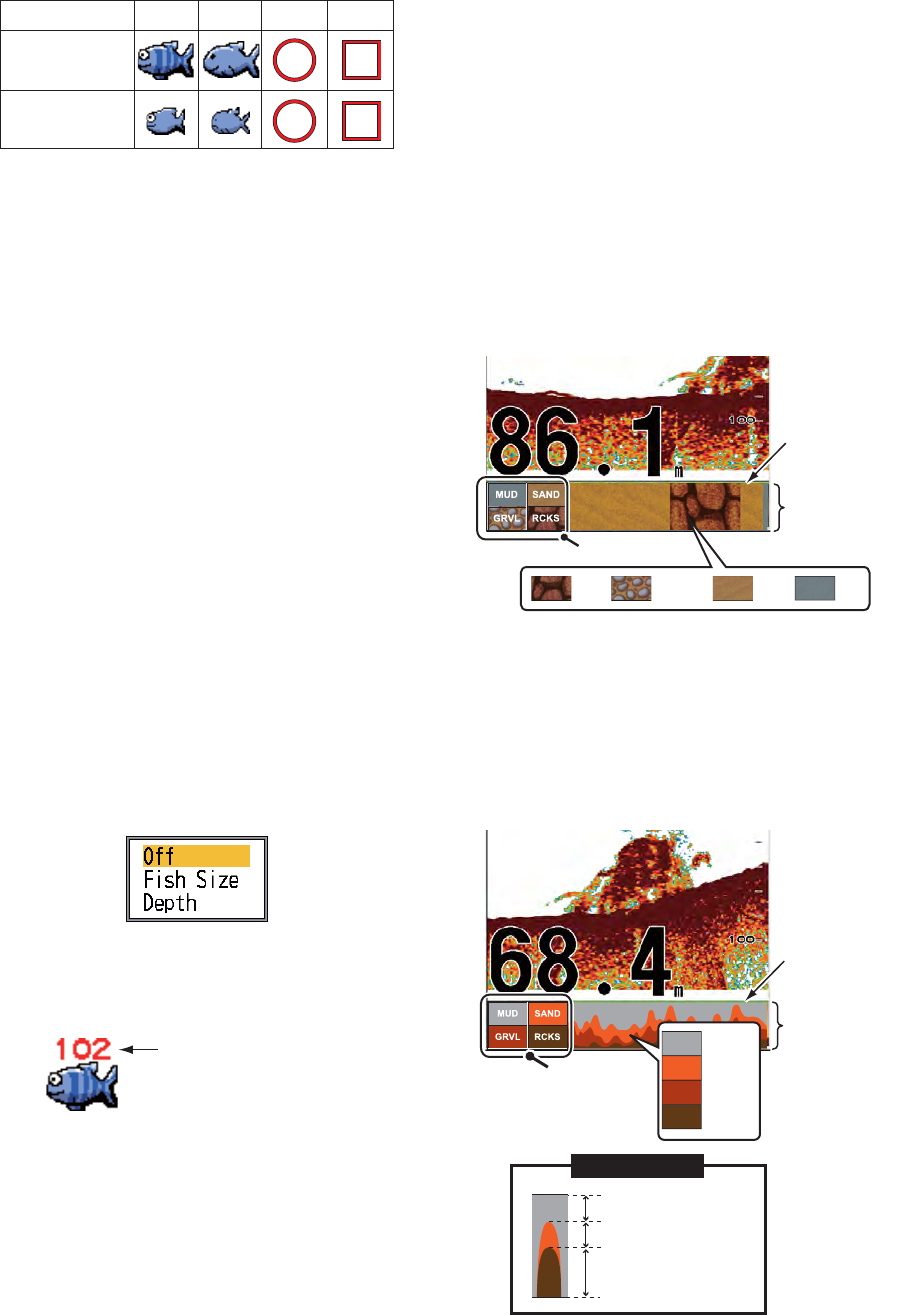
1.16 Bottom Discrimi-
nation Display
The bottom discrimination display analyzes
the bottom echo to categorize bottom hard-
ness in one of four types (rocks, gravel, sand,
mud) and shows the results in a colorful
graphic display. A transducer or triducer that
supports the bottom discrimination display is
required.
There are two bottom discrimination displays:
graphic and probability.
Graphic display: The most probable material
on the bottom (mud, sand, gravel, rock) is in-
dicated graphically.
Probability display: The most probable bot-
tom material is indicated in proportion.
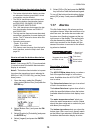
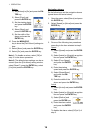
Striped
Solid Circle Square
Large fish symbol
(more than 50 cm, or
more than 20 inches)
Small fish symbol
(10 to 49 cm, or 4 to
19 inches)
Fish length or depth
is shown in red.
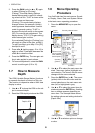
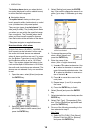
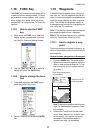
Bottom
discrimination
display column
Probability
bar
Hardness legend
Probability bar:
Degree of trust for bottom discrimination display
(Green, Normal; Yellow, Caution;
Background color, Abnormal)
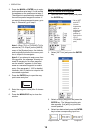
Rock Gravel Sand
Mud㩷
Hardness
legend
Bottom
discrimination
display column
Probability
bar
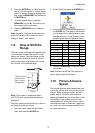
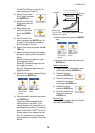
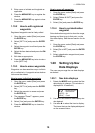
Mud
Sand
Gravel
Rock
Graph example
Mud probability
(Approx. 25%)
Sand probability
(Approx. 25%)
Rock probability
(Approx. 50%)
Graph example