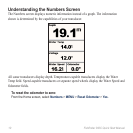
Numbers—displays a set of data elds to show information numerically (page 10).
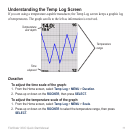
Temp Log—displays a customizable graph of the water temperature when using a
compatible transducer or sensor (page 11).
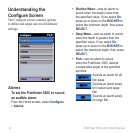
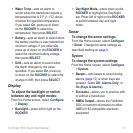
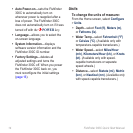
Congure—congures the Fishnder 300C settings (page 12).
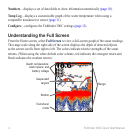
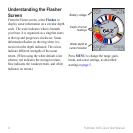
Understanding the Full Screen
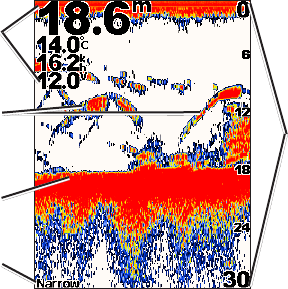
From the Home screen, select Full Screen to view a full-screen graph of the sonar readings.
The range scale along the right side of the screen displays the depth of detected objects
as the screen scrolls from right to left. The colors indicate relative strengths of the sonar
returns. (When using the white default color scheme, red indicates the strongest return and
black indicates the weakest return.)


