


6
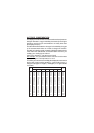
SALINITY COMPENSATION:
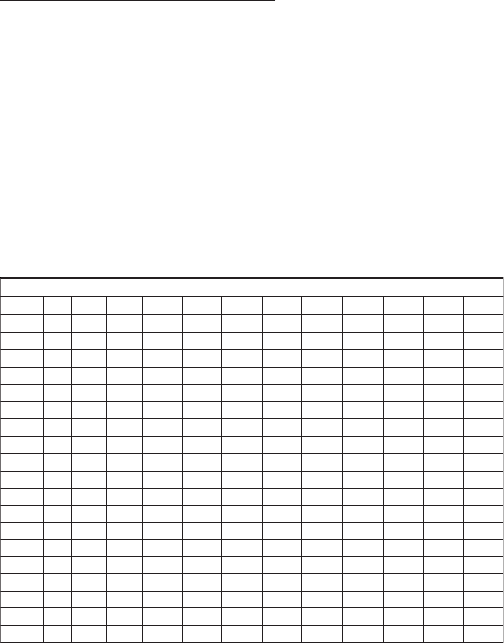
The table below illustrates the change in the solubility of oxygen
in air saturated water as a result of chloride concentration or
salinity.
The table can also be used to correct the displayed measurement.
If you are making measurements in salt water and know the
chloride concentration (or salinity), you can multiply your reading
by the ratio of (ppm at the chloride concentration) / (the ppm at
0 g/L chloride) at the temperature of measurement to compensate
for the salt effect.
levelaeS=rroT067erusserPytinilaSdnaedirolhCnoecnadnepedytilibuloSnegyxO
edirolhCL/g0L/g2L/g4L/g6L/g8L/g01L/g2
1L/g41L/g61L/g81L/g02edirolhC
ytinilaSL/g0L/g6.3L/g3.7L/g9.01L/g5.41L/g1.81L/g7.12L/g3.52L/g9.82L/g5.23L/g1.63ytinilaS
C
° F°
06.412.419.316.313.319.216.213.219.116.113.110.23
28.315.312.319.216.213.210.216.113.110.117.016.53
41.318.215.212.219.116.114.111.1
18.015.012.012.93
64.212.219.116.113.111.118.015.013.010.017.98.24
88.116.113.111.118.016.013.011.018.96.93.94.64
013.110.118.016.013.011.
018.96.94.91.99.80.05
217.015.013.011.019.96.94.92.90.98.85.86.35
413.011.019.97.94.92.90.98.86.84.82.82.75
618.96.94.93.91.99.87.85.83.81.89.78.0
6
814.93.91.99.87.85.83.82.80.88.76.74.46
021.99.87.85.84.82.80.88.77.75.73.70.86
227.86.84.82.81.89.77.76.74.72.71.76.17
424.82.81.89.78.76.74.73.71.
70.78.62.57
522.81.89.78.76.75.73.71.70.78.67.60.77
621.89.78.76.75.73.72.70.79.67.66.68.87
828.77.75.74.72.71.79.68.66.65.63.64.28
036.74.73.71.70.78
.66.65.63.62.60.60.68