


FF520 Page 17
Variable Depth Marker (VDM)
Horizontal line on to the Fish finder page window with a depth label. Move the
ShuttlePoint knob Up or Down to change the position of the VDM. The label displays
the depth of the cursor position. The VDM can be moved to any location pinpointing the
depth of a target.
Zoom Bar
Range bar that is located on the left side of the Depth Ruler representing the current
zoom range. It is turned on in the un-zoomed window of the Standard/zoomed split view
to indicate which portion of the Fish finder page is currently represented in the zoomed
window.
A-Scope
Real time representation of fish and bottom features passing through the beam of the
transducer. It is drawn as column of horizontal lines whose length and hue is
proportional to the echo strength returned. The stronger the echo the larger shall be
the line height. The hue depends on the currently selected palette. When the default
palette is selected, on the color Chart Plotters the strongest sonar returns will be shown
as red and weaker returns will be shown blue.
Operating Frequency
Readout of the selected operating frequency.
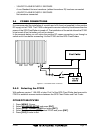
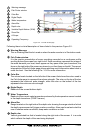
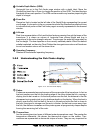
3.0.0 Understanding the Fish Finder display
Figure 3.0.0 - The Fish Finder display
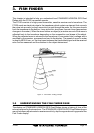
Fishes
Fishes are represented as arcs because of the cone angle of the transducer. In fact as
the boat passes over the fish the leading edge of the cone strikes the fish, causing a
display pixel to be turned on. As the boat passes over the fish, the distance to the fish
decreases turning each pixel on at a shallower depth on the display. When the boat is
directly over the fish, the first half of the arch is formed and since the fish is closer to
the boat, the signal is stronger and the arch is thicker. As the boat moves away from
the fish, the distance increases and the pixels appear at progressively deeper depths
forming the remaining half of the arch.
Thermoclines
Are the zones where two layers of different water temperatures meet. The greater the
temperature differential, the denser the thermocline shows on the screen. Ther-
moclines are represented as horizontal stripes of noise. They are very important for