


82
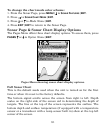
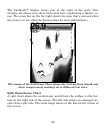
The FasTrack™ display shows just to the right of the scale. This
changes all echoes into short horizontal bars, replicating a flasher so-
nar. The zoom bar on the far right shows the area that's zoomed when
the zoom is in use. (See the Zoom section for more information.)
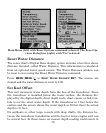
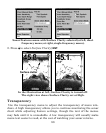
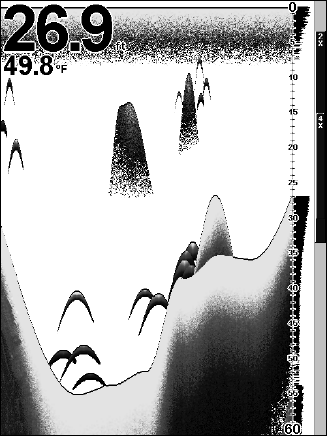
This image of the Full Sonar Chart shows the Overlay Data (depth and
water temperature) readings set at different text sizes.
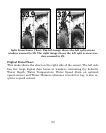
Split Zoom Sonar Chart
A split chart shows the underwater world from the surface to the bot-
tom on the right side of the screen. The left side shows an enlarged ver-
sion of the right side. The zoom range shows at the bottom left corner of
the screen.