


7. CUSTOMIZING YOUR UNIT
7-17
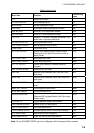
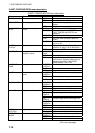
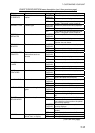
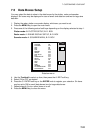
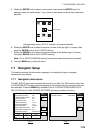
CHART CONFIGURATION menu description (con’t from previous page)
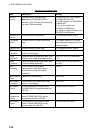
Object Content Setting Description
PLOTTER/
OVERLAY
Shown on plotter and overlay displays.
PLOT Shown on plotter display.
TIDES &
CURRENTS
Tidal station and current
station
OFF Tidal station and current station are not
shown. Tidal graph is also turned off.
PLOTTER/
OVERLAY
Shown on plotter and overlay displays.
PLOT Shown on plotter display.
SEABED TYPE Seabed type
OFF Tidal station and current station are not
shown. Tidal graph is also turned off.
PLOTTER/
OVERLAY
Shown on plotter and overlay displays.
PLOT Shown on plotter display.
PORTS &
SERVICES
Ports and services
OFF Ports and services are not shown. Near
Service also not shown.
PLOTTER/
OVERLAY
Shown on plotter and overlay displays.
PLOT Shown on plotter display.
TRACKS &
ROUTES
Tracks and routes
OFF Tracks and routes are turned off.
PLOTTER/
OVERLAY
Shown on plotter and overlay displays.
PLOT Shown on plotter display.
UNDERWATER
OBJECTS
Below-surface
obstructions such as
wrecks
OFF Underwater objects are turned off.
PLOTTER/
OVERLAY
Shown on plotter and overlay displays.
PLOT Shown on plotter display.
RIVERS &
LAKES
Rivers and lakes
OFF Rivers and lakes are turned off.
PLOTTER/
OVERLAY
Shown on plotter and overlay displays.
PLOT Shown on plotter display.
LAND
FEATURES
Land features
OFF Rivers and lakes are turned off.
PLOTTER/
OVERLAY
Shown on plotter and overlay displays.
PLOT Shown on plotter display.
LANDMARKS Landmarks
OFF Landmarks are turned off.
PLOTTER/
OVERLAY
Shown on plotter and overlay displays.
PLOT Shown on plotter display.
LAT/LON GRID Latitude and longitude
grids
OFF Latitude and longitude grids are turned
off.
ON Shown on plotter and overlay displays.
AUTO Chart border lines are shown for the last
four charts in a chart card on the plotter
and overlay displays
PLOTTER/
OVERLAY
Chart border lines show on plotter and
overlay displays.
PLOT Chart border lines show on plotter
display.
CHART
BOUNDARIES
Chart boundary lines
OFF Chart boundaries are turned off.
ON Mixing is active. MIXING Changes chart scale to fit
whole chart on display
OFF Mixing is disabled.
(Con’t on next page)