


41
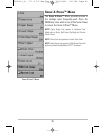
Chart Speed
Chart Speed determines the speed at which the
sonar information moves across the display, and consequently the amount of
detail shown. A faster speed shows more information and is preferred by most
anglers; however, the sonar information moves across the display quickly. A
slower speed keeps the information on the display longer, but the bottom and
fish details become compressed and may be difficult to interpret. Regardless of
the Chart Speed setting, the RTS® Window will update at the maximum rate
possible for the depth conditions. Adjust Chart Speed to your personal
preference.
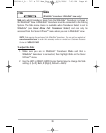
T
o adjust the Chart Speed:
1. Highlight Chart Speed on the Sonar X-Press™ Menu.
2. Use the LEFT or RIGHT 4-Way Cursor Control keys to increase or
decrease the Chart Speed setting. (1-9, Ultra, where 1 = Slow, 9 = Fast,
Ultra = Fastest, Default = 5)
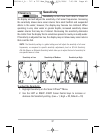
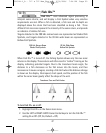
Bottom View
Bottom View selects the method used to represent
bottom and structure on the display.
Inverse represents weak returns as dark pixels and strong returns as lighter
pixels. This has the benefit of ensuring that weak signals will be clearly visible on
the display.
Structure ID® represents weak returns as light pixels and strong returns as dark
pixels. This has the benefit of ensuring that strong returns will be clearly visible
on the display.
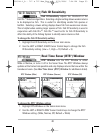
WhiteLine® highlights the strongest sonar returns in white resulting in a
distinctive outline. This has the benefit of clearly defining the bottom on the
display.
Bottom Black displays all pixels below the bottom contour as black, regardless
of signal strength. This has the benefit of providing a high contrast between the
bottom and other sonar returns on the display. Any targets such as fish, structure
and thermoclines will be shown using the Structure ID® method.
See Bottom Presentation for more information.
531524-1_A - 717 & 727 Man_Eng.qxp 9/30/2006 7:23 PM Page 46