


11
User Manual
2. Fish Finder
This chapter is intended to help you understand how the chart plotter with the
Fish Finder connected operates to improve your fishing.
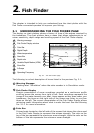
2.1 UNDERSTANDING THE FISH FINDER PAGE
The display on chart plotters shows a history of time of the echoes received by
the transducer. The chart plotters have a menu that allows adjustments to re-
ceiver sensitivity, depth range and scrolling speed of the Fish Finder display.
Color Bar
5
3
Fish Finder Display window
Depth ruler
2
Variable Depth Marker (VDM)
Zoom Bar
8
9
7
4
Digital Depth
Water temperature
Warning message
1
7
1
5
3
6
8
9
A-Scope
10
6
2
6
Alarm Bar
11
4
10
Operating Frequency
11
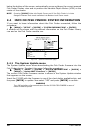
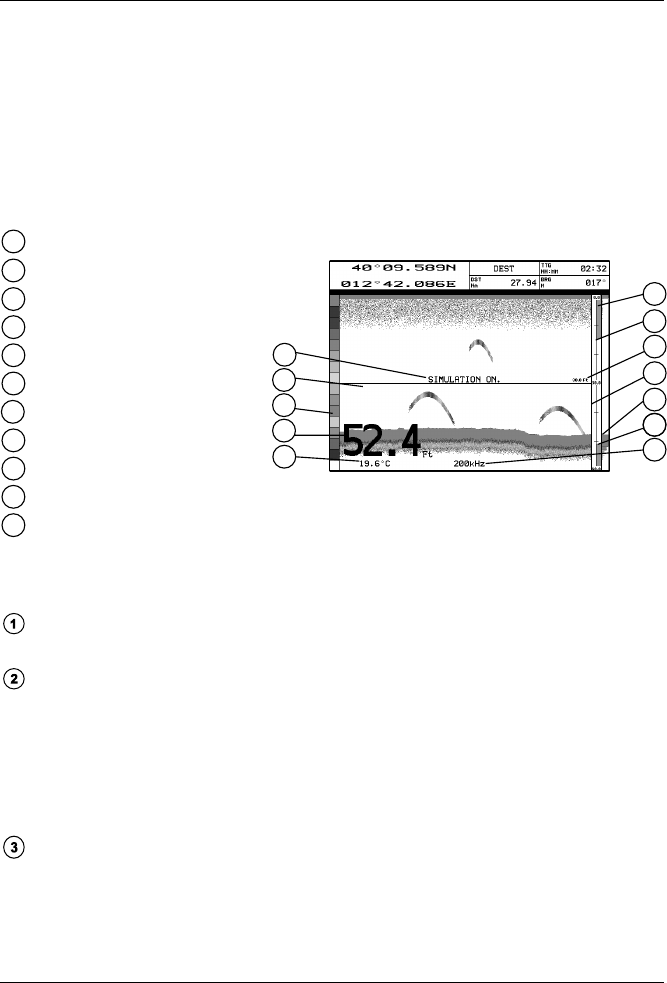
Fig. 2.1 - The Fish Finder page
The following is a short description of terms listed in the previous Fig. 2.1:
Warning Message
Flashing label "Simulation" when the echo sounder is in Simulation mode.
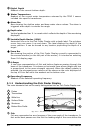
Fish Finder Display
Graphic presentation of sonar soundings recorded as a continuous profile
scrolling across the screen from right to left. Such recordings represent the
image of the water beneath your boat, items appear as they pass under your
transducer; the items on the right side of the screen are closer to you than
those on the left. The correct interpretation of the Fish Finder Display allows
retrieving useful information about what is under the boat. See the following
Par. 2.1.1 for more information.
Color Bar
Colored scale located on the left side of the screen that shows the colors used
in the Fish Finder Display to represent the echoes strength. The color on the
top of the bar represents the maximum sonar strength, while the color on the
bottom of the bar represents the minimum sonar strength.