


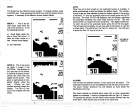

Both 8
degree
and
20
degree
transducers
give
accurate bottom read-
ings,
even
though
the
bottom
signal
is
much wider on the 20
degree
model. This is because
you
are
seeing
more
of the bottom. Remem-
ber,
the shallow
edge
of the
signal
shows
you
the
true
depth.
The rest
of the
signal
tells
you
whether
you
are over
rocks, mud,
etc.
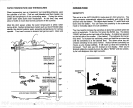
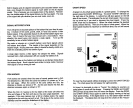
SIGNAL INTERPRETATION
Your unit
gives
an accurate
picture
of the bottom that
your
boat is
pass-
ing.
A bottom of firm
sand, gravel,
shell,
or hard
clay
returns a wide
bottom
signal.
If the automatic
feature is off and the bottom
signal
nar-
rows
,
then it means that
you
have moved over a mud
bottom. Mud
absorbs the sound wave and
returns a weak
signal.
Turn
up
the
sensitivity
to see a better
bottom
signal.
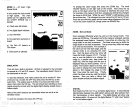
Big
rocks or
stumps
on
a smooth bottom send back
signals
above
the bottom level
signal.
The
height
of the
signal
depends
on the
target's height.
As
you pass
over a
post,
ft should be
clearly
visible as a
short line
extending
above
the bottom
signal.
A
steep slope
returns a
wide
signal,
the
steeper
the wider.
Signals
returned from a
high
underwater
cliff are
usually
the widest of all.
Brush
usually
lies on the bottom
and shows
up
as
clumps rising
above
the bottom
signal.
Brush
signals
look similar to
large
rocks;
however
their
signal
is not as
strong
as rock.
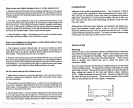
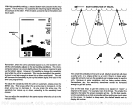
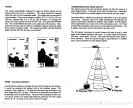
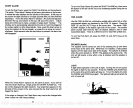
FISH ARCHES
Fish arches are created
when the cone of sound
passes
over a fish.
The distance to a fish
when the cone first strikes
it is shown as "A" on
the next
page.
When the
center of the cone strikes
the
fish,
the
distance is
shorter,
as shown
in "B". As the cone
leaves the
fish,
the
distance increases
again
as
shown in "C".
When the
Fish l.D. feature is
off,
the
depth
of the water will affect
the
size and
shape
of the fish arch due to
the cone
angle
diameter.
For
example,
if the cone
passes
over a fish in shallow
water,
the
signal
displayed
on the unit
may
not arch
at all. This is due to the narrow
cone
diameter
and the resolution limitations of the
display!
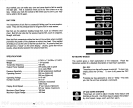
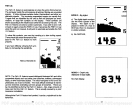
CHART
SPEED
At
power
on,
the chart
speed
scrolls at
a
preset speed.
To
change
the
speed, press
the
CHART SPEED
key.
The word "CHART"
will flash on
the
right
side of the
display.
A vertical
bar will also
appear
on the
left
side of the screen.
This indicates the current
chart
speed.
Next,
press
the
up
arrow
key
if
you
wish to increase
the chart
speed.
Press the
down arrow
key
to decrease ft. When the
chart reaches the desired
speed,
release .the
key.
There are five
steps
of chart
speed.
When the
chart
speed
reaches its maximum
or minimum
level,
the unit
will sound
a tone.
To view the chart
speed
without
changing
it,
press
the CHART
SPEED
key.
The chart
speed
bar
will
appear
for
eight
seconds.
At times it is desirable
to
stop
or "freeze" the
display
to examine an
echo before it scrolls off
the screen.
Pressing
the SENS. and
CHART
SPEED
keys
at the same time
will freeze the
display.
Press the
SENS.
and CHART SPEED
keys again
to start the
display moving
at
the last
chart
speed selling.
If the
digital
sonar is
on,
the bottom
depth
will still
be
displayed.
The
digital
does not
stop
when the chart is in the
"freeze"
mode.
18
7
PDF compression, OCR, web-optimization with CVISION's PdfCompressor