


8-1
8. HOW TO CONTROL CHART
OBJECTS
This chapter provides the information necessary for controlling chart features.
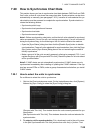
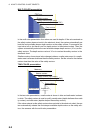
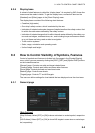
8.1 How to Browse Your Charts
You can view your charts using different positions and different scales. The basic tools
for browsing charts are the RANGE key, chart offcenter, and scroll.
RANGE - and RANGE + change the chart scale. (The scrollwheel also can change
the chart scale. Spin to change.) If true motion reset is active, ZOOM IN and ZOOM
OUT keep the relative position of your ship with respect to the display. If true motion
reset is off, ZOOM IN and ZOOM OUT keep the relative position pointed by the cursor
with respect to the display. The system automatically selects next larger or smaller
scale. If a chart with larger compilation scale is available at your current viewing posi-
tion, the message "Larger scale ENC available" appears.
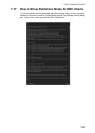
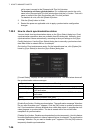
The own ship position can be easily relocated to the screen center in the Navigation
voyage and Navigation planning modes. Further, in the Navigation voyage mode, the
own ship position can be put at the cursor position.
To move the own ship mark to the screen center, put the cursor in the chart area
and right-click [Ship on center]. To move the own ship mark to a location, right-click
the position on the chart where to put the own ship mark then right-click [Ship off cen-
ter]. ([Ship off center] is not available in the Voyage planning mode.)
To scroll your chart, simply drag and drop.
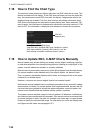
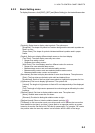
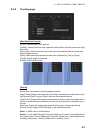
8.2 How to Control Visibility of Chart Objects
The [Chart Display] menu has several pages of chart features that you may show or
hide as appropriate. To display this menu, click the [DISP], [SET] and [Chart DISP]
buttons on the InstantAccess bar.
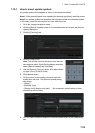
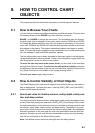
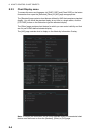
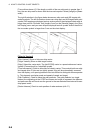
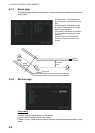
8.2.1 How to set value for shallow contour, safety depth, safety con-
tour and deep contour
You can set values for shallow contour, safety depth, safety contour and deep contour,
on the [Chart Alert] dialog box (sequence: [DISP], [SET], [Chart Alert]). Colors used
for depth presentation on the electronic chart are controlled by setting values for shal-
low contour, safety depth, safety contour and deep contour. Soundings on the elec-
tronic chart, which are equal to or less than the value of safety depth, are highlighted.
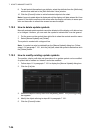
See the illustrations on the next page for multi-color presentation and two-color pre-
sentation. Selection of multi- and two-color presentations can be done by selecting
from list box of [Depths] on the [Basic Setting] menu.
Note: The shallow contour cannot be set higher than the safety contour.