


4
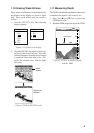
50k
49.6
0.0
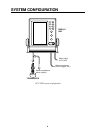
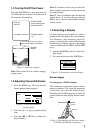
Fish
school
Bottom
0
20
40
60
80
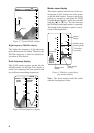
Figure 1-7 Typical 50 kHz display
High frequency (200 kHz) display
The higher the frequency of the ultrasonic
pulse the better the resolution. Therefore, the
200 kHz frequency is ideal for detailed ob-
servation of fish schools.
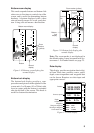
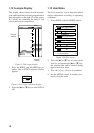
Dual-frequency display
The 50 kHz picture appears on the left; the
200 kHz picture on the right. This display is
useful for comparing the same picture with
two different transmitting frequencies.
50/200
60
49.6
0.0
50 kHz 200 kHz
picture picture
0
20
40
80
0
20
40
Figure 1-8 Dual-frequency display
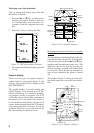
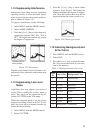
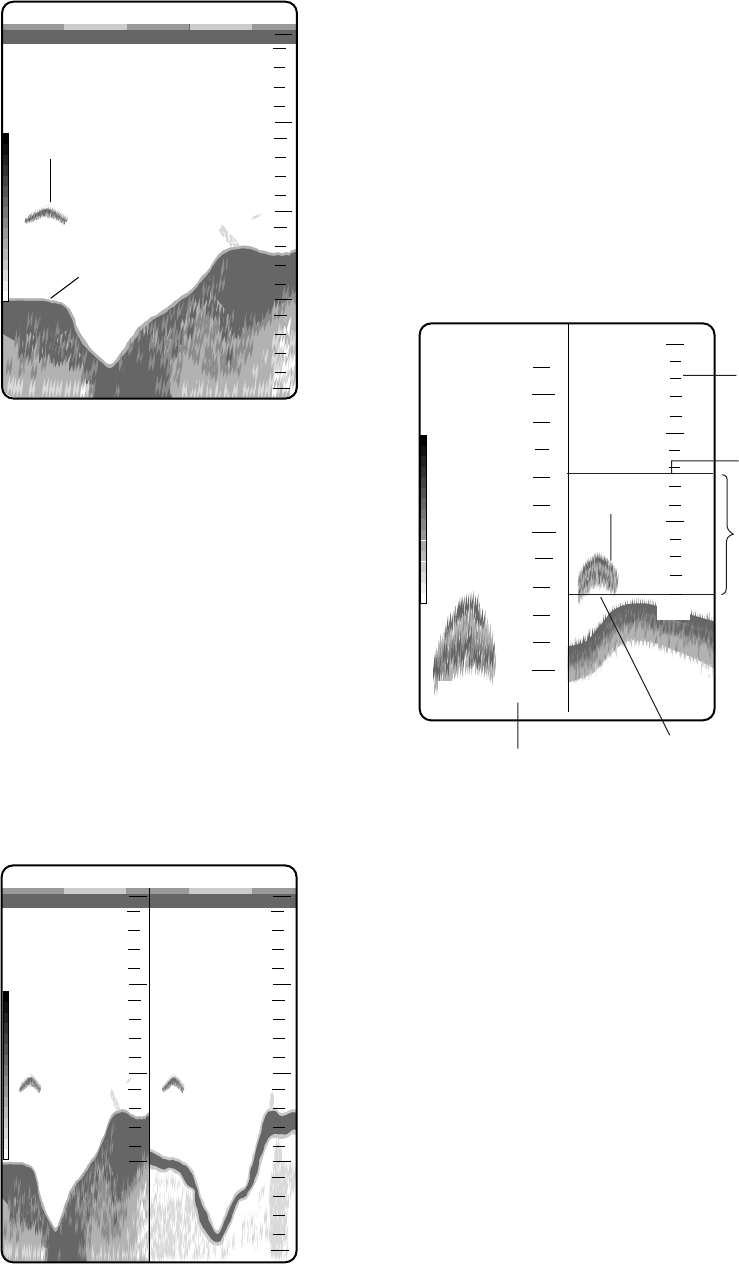
Marker-zoom display
This mode expands selected area of the nor-
mal picture to full vertical size of the screen
on the left-half window. You may specify the
portion to expand by operating the VRM
(Variable Range Marker), which you can shift
with the [▲] or [▼] key. The area between
the VRM and zoom range marker is expanded.
The length of the segment is equal to one di-
vision of the depth scale.
14.7
0
10
20
30
15
20
25
28.2
Zoomed fish
school
Normal
display
Variable range
marker (green)
This section
is zoomed
Zoom marker
(yellow)
Marker-zoom
display
Fish
school
Figure 1-9 Marker-zoom display
plus normal display
Note : The zoom marker looks like white
when the background is blue.