36
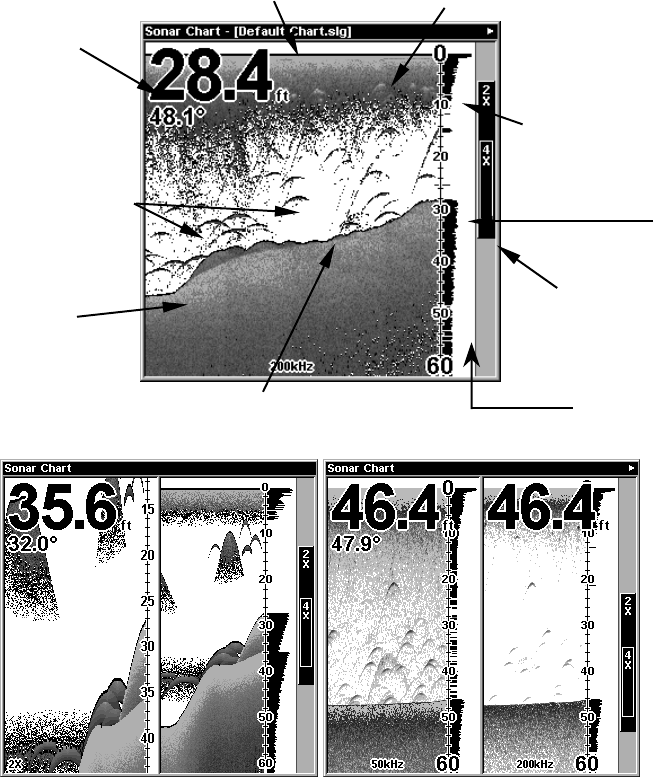
The Full Sonar Chart is the main display option. This is a "cross-
section" view of the water column beneath the boat. The chart moves
across the screen, displaying sonar signal echoes that represent fish,
structure and the bottom.
Sonar Page, showing full sonar chart mode.
Sonar chart display options (from left) split zoom (all models)
and split frequency (X126DF and X136DF only).
Surface clutter
Structure
Bottom signal
Fish arches
In FasTrack, fish
arches show as
horizontal bars.
Depth scale
Digital data
overlay
(depth &
temperature)
Surface signal
Zoom bar
FasTrack
bar graph


