


8
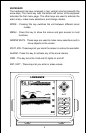
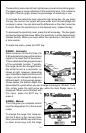
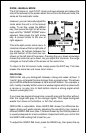
Full Chart
This is the default mode used when
the X-65 is first turned on. The bottom
signal scrolls across the screen from
right to left. Depth scales on the right
side of the screen makes it easy to
determine the depth of fish, structure,
and other objects. The line at the top
of the screen represents the surface.
The bottom depth shows at the top left
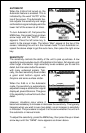
corner of the screen. The word "AUTO"
at the screen's top center shows that
the X-65 is in the automatic mode,
freeing you from sensitivity, range, and noise rejection adjustments.
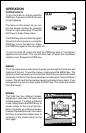
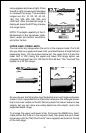
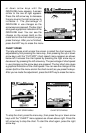
Split Chart
A split chart shows the underwater
world from the surface to the bottom
on the right side of the screen. The left
side shows an enlarged version of the
right side. The zoom range shows at
the bottom of the screen. In this ex-
ample, the zoom range is 2X, or two
times the right side's view. By press-
ing the ZOUT and ZIN keys, you can
change the left side's zoom from 2X to
4X and back.
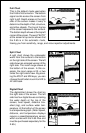
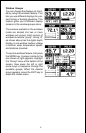
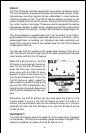
Digital/Chart
The digital/chart shows the chart on
the right side of the screen. The left
side has four digital boxes containing
the water depth at the top of the
screen, boat speed, distance trav-
elled (log), and surface water tem-
perature. At the bottom of the screen
is a temperature graph. (Note: Speed,
distance, and temperature displays
require a speed/temperature sensor
which comes with the X-65 Plus and
must be purchased separately for the
X-65.)