© 2011 Schneider Electric. All Rights Reserved.
PowerLogic
TM
Series 800 Power Meter 63230-500-225A2
Chapter 9—Disturbance Monitoring (PM870) 3/2011
66
System voltage sags are much more numerous than interruptions, since a wider part of the
distribution system is affected. And, if reclosers are operating, they may cause repeated
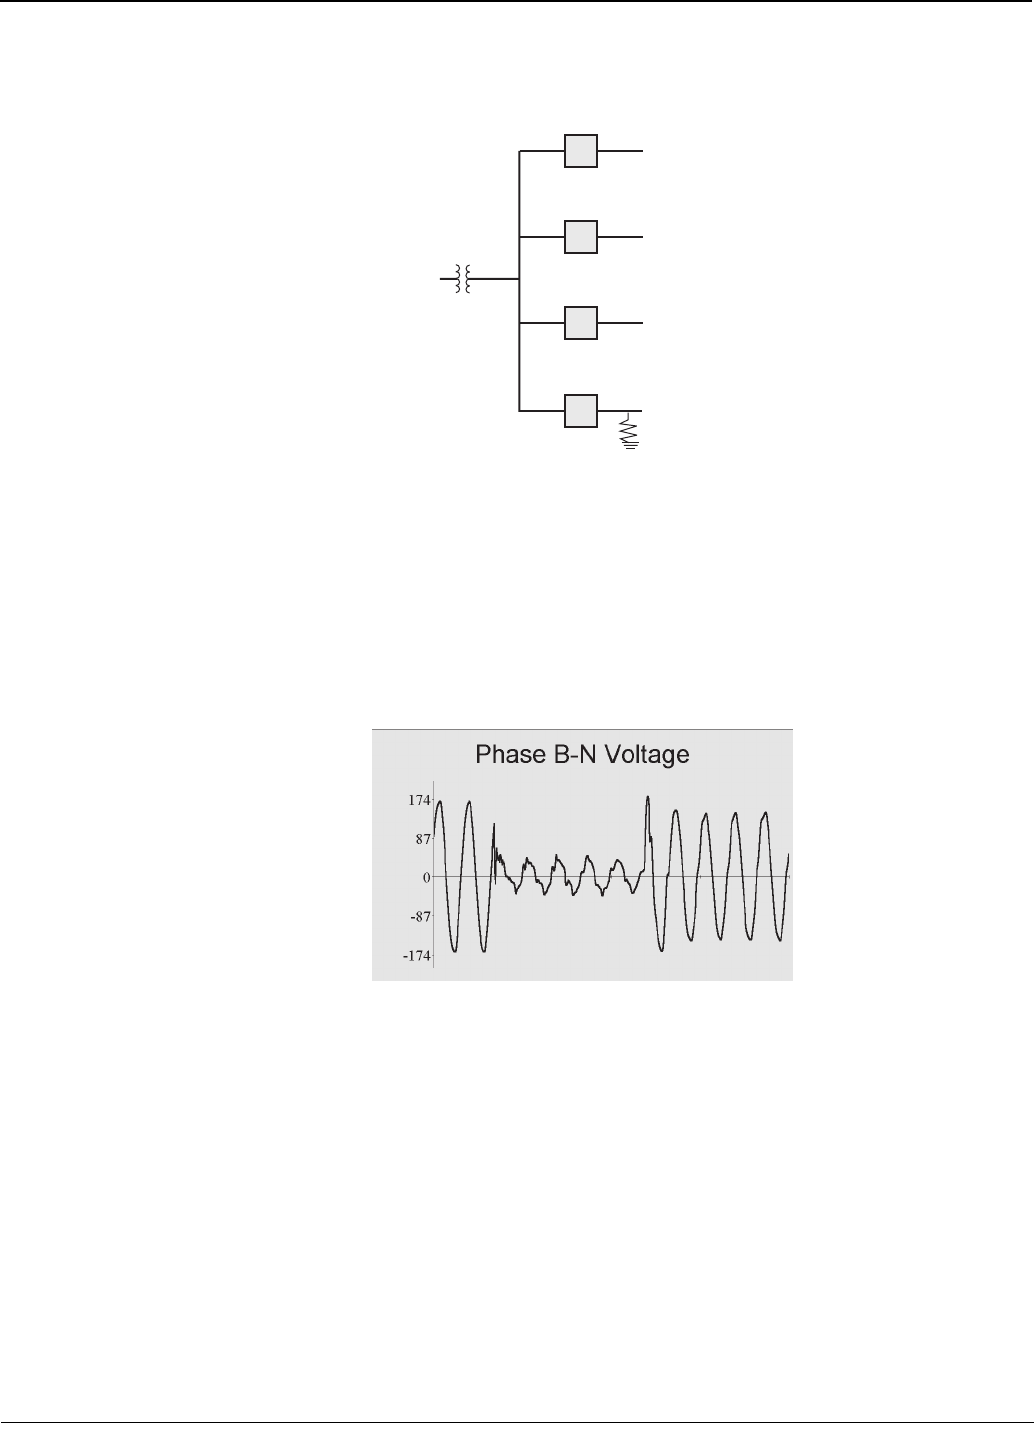
sags. The PM870 can record recloser sequences, too. The waveform in Figure 9–2 shows
the magnitude of a voltage sag, which persists until the remote fault is cleared.
With the information obtained from the PM870 during a disturbance, you can solve
disturbance-related problems, including the following:
• Obtain accurate measurement from your power system
— Identify the number of sags, swells, or interruptions for evaluation
— Accurately distinguish between sags and interruptions, with accurate recording of
the time and date of the occurrence
— Provide accurate data in equipment specification (ride-through, etc.)
• Determine equipment sensitivity
— Compare equipment sensitivity of different brands (contactor dropout, drive
sensitivity, etc.)
— Diagnose mysterious events such as equipment malfunctions, contactor dropout,
computer glitches, etc.
— Compare actual sensitivity of equipment to published standards
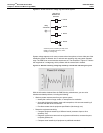
Figure 9–1: A fault can cause a voltage sag on the whole system
Figure 9–2: Waveform showing voltage sag caused by a remote fault and lasting five cycles
X
A fault near plant D, cleared by the utility circuit
breaker, can still affect plants A, B, and C,
resulting in a voltage sag.
Utility Circuit
Breakers with
Reclosers
Utility
Transformer
1 Plant A
2 Plant B
3 Plant C
4 Plant D
Fault


