Appendix B
Warranty
Viewing Data in DMS
The following section outlines viewing your data with the QT⁰ 44/46 models.
Selecting a session/study
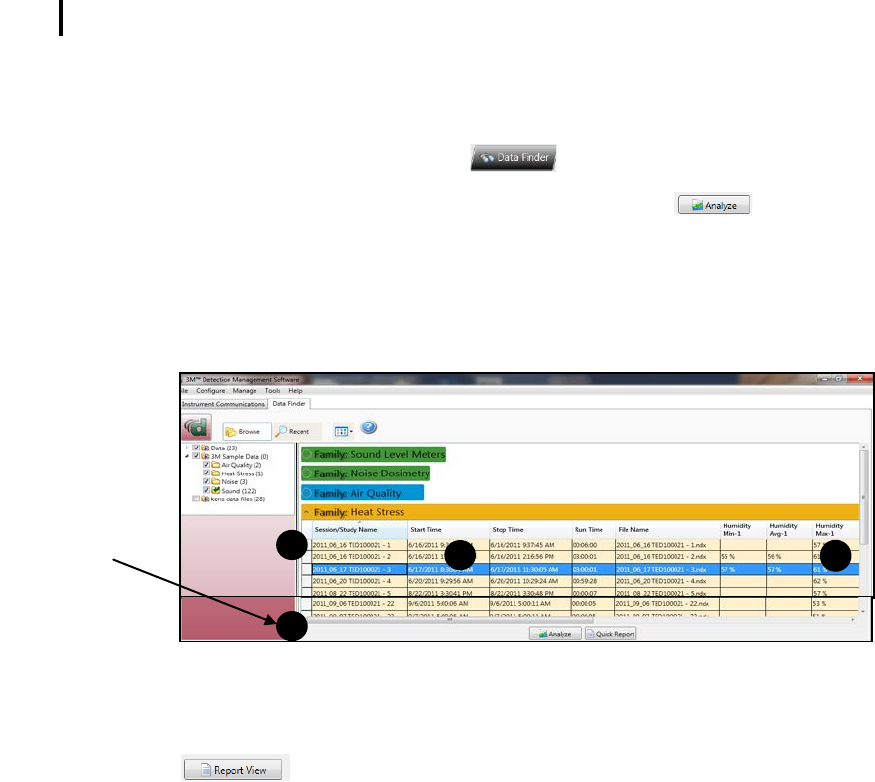
To view downloaded data from the welcome page, click on the button and the data finder screen will appear.
(Or select the Data Finder tab if already opened.)
1. Select a session by either double-clicking on data or click on the session/study and select the button. (Note:
the example below illustrates a session selected with a run time of 3 minutes.) (See 1).
• Family: Heat Stress: QT⁰44/46 data is stored in this family. (See 2).
• Session/Study: The EVM data is organized by the table headings, such as the session/study name (See 3).
• Start Time: To quickly locate your study by most recent start time, click on the Start Time heading and it will sort
ascending/descending (See 4).
• Parameters & measurements: The table headings and columns are customizable by a quick click, drag, and drop
to a new column location (similar to MS Excel.)
Figure 1-33: Selecting a session
Charts and Graphs in Panel layout view (PLV) page
The measurements and parameters will be displayed in charts and graphs which may be customized for analysis and/or
reporting purposes.
• Note: a button provides a quick link to viewing the panel layout view data in a report format.
1. In the PLV page, it is divided into Work Items (see A), Add panel (see B), Arrange Panels (see C) and Data Panels
(see D).
• Work items (A) – select either the session or study (in order to view appropriate measurement/parameter data).
• Add panel (B) – double-click on a chart/table type and it will appear as a panel on your screen.
• Arrange panels (C) – displays the order of the charts/tables which appear in the panel layout. Also, when a chart/table is
selected in the arrange panels palette, the associated data panel is selected. The resize handles are applied and the
panel is brought into view. (This is very useful when several panels are displayed.) To delete a panel, right-click on a
chart/table and press delete from your keyboard.
• Data panels (D) – used to view your measurement and/or parameters from your study. Note: use the menu bar icons
and/or configure icon to customize parameters.
select/view
QT⁰44/46 data in
charts and graphs


