


Appendix B
Warranty
37
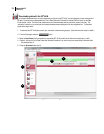
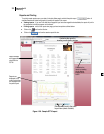
2. To change the graph/table data parameters, click on the button. Each graph/table may have different
configurable parameters depending on the parameters applicable to the specific panel.
3. To view the data as a report, click the button. (Note: the panels will print in the order in which they are
displayed in the panel layout page.)
4. The quick tips below explain how to customize the panels and/or graphs/tables:
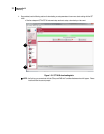
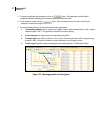
• To stretch the graph/tables, click on one the corner’s edge of a chart or table and drag the mouse. (Note: selection
handles will appear. See A.) The graph/table will expand or shrink when resizing.
• To move the graph, click, drag and drop to the appropriate panel position.
• To change ranges, when clicking on either the x-axis or y-axis, click and drag the mouse until the appropriate range
is selected. (Note: it will span the numbers up or down depending on how you drag the mouse.)
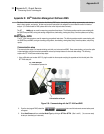
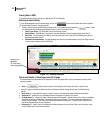
• To save a layout, Right-click outside the tables/graphs area as displayed below. Click Remember Setting.
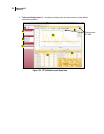
Figure 1-35: Rearranging panels and saving layout
Remember setting