


31
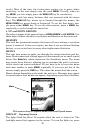
If an optional speed or temperature sensor is connected, digital displays for
speed and/or temperature will also be shown.
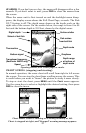
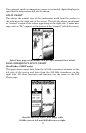
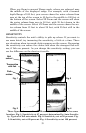
SPLIT CHART
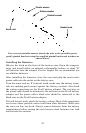
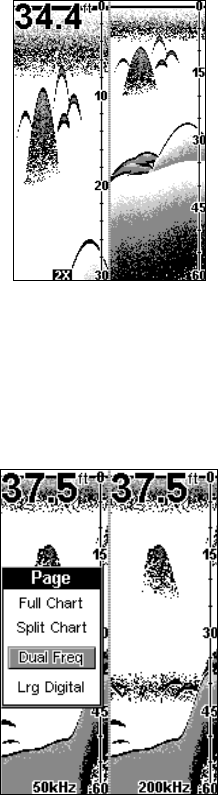
This shows the normal view of the underwater world from the surface to
the bottom on the right side of the screen. The left side shows an enlarged
or "zoomed" version of the echoes appearing on the right side. A zoom mes-
sage, such as "2X," appears at the bottom of the "zoomed" side of the screen.
Split Chart page with normal view at right; zoomed view at left.
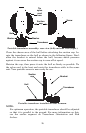
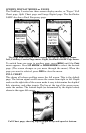
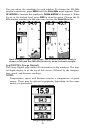
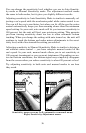
DUAL-FREQUENCY SPLIT CHART
(SeaFinder 240DF only)
This page shows sonar data from the 50 kHz transducer element on the
left side of the screen and data from the 200 kHz transducer on the
right side. All other functions and features are the same as the Full
Chart page.
Dual-Frequency Split Chart page, with
50 kHz view at left and 200 kHz view at right.