64
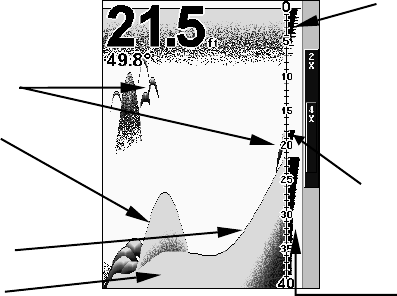
tions directly under the boat. This makes it useful for ice fishing, or
when you're fishing at anchor. When the boat is not moving, fish sig-
nals are long, drawn out lines on a normal chart display. FasTrack con-
verts the graph to a vertical bar graph that, with practice, makes a use-
ful addition to fishing at a stationary location.
Sonar Page showing FasTrack.
Fish I.D. (Fish Symbols & Depths)
The Fish I.D. feature identifies targets that meet certain conditions as
fish. The microcomputer analyzes all echoes and eliminates surface
clutter, thermoclines, and other signals that are undesirable. In most
instances, remaining targets are fish. The Fish I.D. feature displays
fish symbols on the screen in place of the actual fish echoes.
There are several fish symbol sizes. These are used to designate the
relative size between targets. In other words, Fish I.D. displays a small
fish symbol when it thinks a target is a small fish, a medium fish sym-
bol on a larger target and so on.
The sonar's microcomputer is sophisticated, but it can be fooled. It can't
distinguish between fish and other suspended objects such as trotlines,
turtles, submerged floats, air bubbles, etc. Individual tree limbs ex-
tending outwards from a group of limbs is the hardest object for the
Fish I.D. feature to distinguish from fish.
You may see fish symbols on the screen when actually, there are no
fish. The reverse is also true. The illustrations on the next page show
how Fish I.D. can actually miss fish that are present.
Does that mean Fish I.D. is broken? No — the feature is simply inter-
preting sonar returns in a specific way to help take some of the work
out of reading the screen. Remember: Fish I.D. is one of the many tools
we provide so you can analyze your sonar returns for maximum fish
Structure
Bottom signal
Fish arches
In FasTrack, fish
arches show as
horizontal bars.
FasTrack
bar graph
ColorLine
Surface clutter


