77
mode, the Reset Options command will switch back to Auto and re-
set the factory setting at the same time.
Tip:
For quicker sensitivity adjustments, try leaving the Sensitivity
Control Bar on the screen as the chart scrolls. You can see the
changes on the screen as you press the up or down arrows. This is
handy when there's a lot of clutter in the water, and you are
matching the sensitivity to rapidly changing water conditions.
Sonar Chart Mode
The default color scheme for the sonar chart is white background, but
we offer other variations to suit your viewing preferences. You can se-
lect the chart to be displayed in grayscale, reverse grayscale, blue back-
ground, or Nightview, IceView, or bottom color tracking.
To change the chart mode color scheme:
1. From the Sonar Page, press
MENU|↓ to SONAR FEATURES|ENT.
2. Press ↓ to
SONAR COLOR MODE|ENT.
3. Press ↓ or ↑ to Mode Name|
ENT.
4. Press
EXIT|EXIT to return to the Sonar Page.
Sonar Page & Sonar Chart Display Options
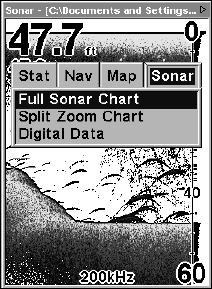
The Pages Menu offers three chart display options. To access them, press
PAGES|→ to SONAR|↓ to Option Name|EXIT.
Pages Menu, showing sonar chart display options.
Full Sonar Chart
This is the default mode used when the unit is turned on for the first
time or when it's reset to the factory defaults.
The bottom signal scrolls across the screen from right to left. Depth
