


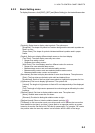
8. HOW TO CONTROL CHART OBJECTS
8-2
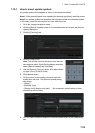
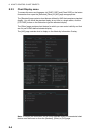
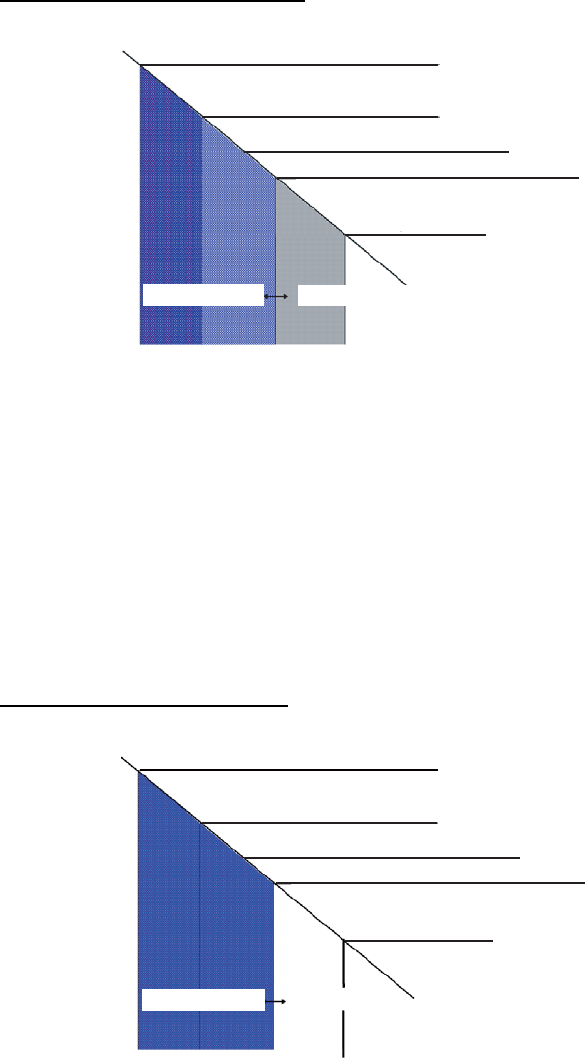
MULTI-COLOR presentation
In the multi-color presentation four colors are used for depths. If the value entered as
the safety contour does not exist in the electronic chart, the system automatically se-
lects the next available deeper depth contour as the safety contour. For example, the
input value is 8 m, but there is no 8 m depth contour in the electronic chart. Then, the
system automatically selects the next available deeper depth contour (10 m) as the
safety contour. The depth contour value of 10 m is used as the safety contour in the
electronic chart.
Shallow contour shows visual color change inside an unsafe water area. An unsafe
water area is all areas shallower than the safety contour. Set the value for the shallow
contour less than the value of the safety contour.
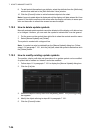
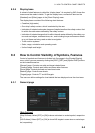
TWO-COLOR presentation
In the two-color presentation, unsafe water is shown in blue and safe water is shown
in white. The safety contour is used to qualify unsafe water (depth shallower than safe-
ty contour) and safe water (depths deeper than safety contour).
If the value entered as the safety contour does not exist in the electronic chart, the sys-
tem automatically selects the next deeper available depth contour as the safety con-
tour, the same as with the multi-color presentation.
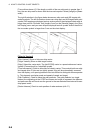
Chart zero
Shallow contour
Safety contour (input value)
Safety contour (exisiting in ENC)
Deep contour
Non-navigable area
Navigable area
Non-navigable area
Chart zero
Shallow contour
Safety contour (input value)
Deep contour
Safety contour (exisiting in ENC)
Navigable area