


18
To toggle the data fi eld display:
1. Use the ARROW keys to highlight the ‘Advanced Data Fields’ fi eld and press ENTER.
2. Select ‘On’ or ‘Off’ and press ENTER.
To access the Advanced data setup:
1. Use the ARROW keys to highlight ‘Confi gure Advanced Data Fields’ and press ENTER.
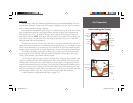
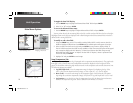
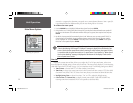
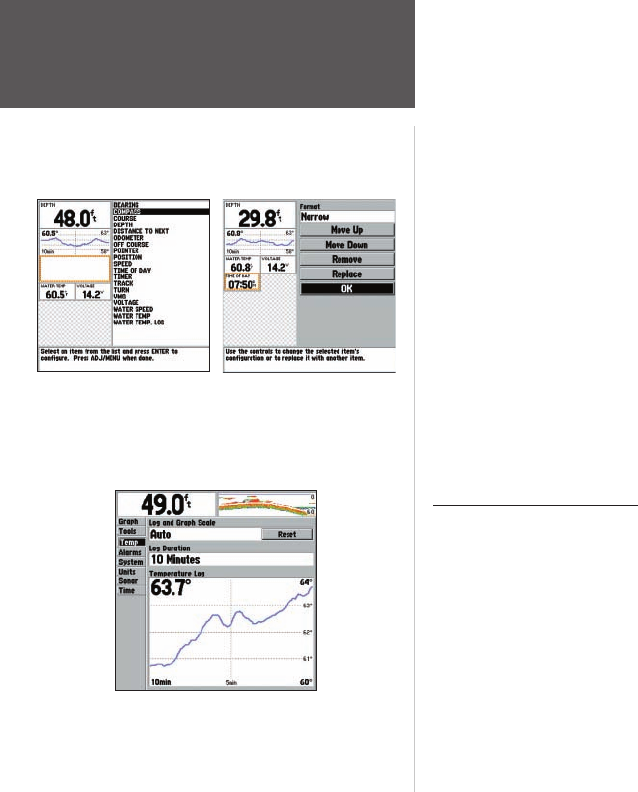
You may either directly edit an existing fi eld on the left or add a new data fi eld from the list on the right.
Highlighted items on the right are displayed with a black background and the associated fi eld on the left is
outlined with a moving dotted line.
To modify or add a data fi eld:
1. Using the ARROW keys, press LEFT to modify an existing fi eld or RIGHT to add a new one, then UP or
DOWN to highlight the desired item. Press ENTER and the available options will appear on the right.
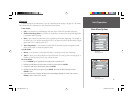
2. Select an option from the list on the right and press ENTER. You may choose to display a ‘Wide’ or
‘Narrow’ sized format (some data fi elds are only available in ‘Wide’ format and this option will be grayed
out), arrange the display order with ‘Move Up’ or ‘Move Down’ (Narrow data fi elds always arrange
below Wide data fi elds), ‘Remove’ or ‘Replace’ the data fi eld. For ‘Replace’, choose a replacement item
from the list and press ENTER.
3. Highlight ‘OK’ and press ENTER to save changes.
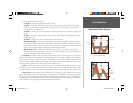
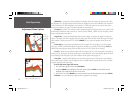
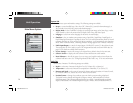
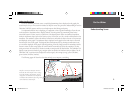
Temp (Temperature) Tab
Displays the water temperature log (if equipped with a temperature transducer/sensor). The graph reads
from right to left, so that the most recent temperature measured is displayed on the far right side of the
graph. The dotted lines within the graph indicate intervals in the temperature scale and the duration of time.
The following settings are available:
• Log and Graph Scale — sets the temperature range (in degrees) for displaying the log. Select
‘Auto’ to have the unit determine the best range, or select a span of 2, 4, 6, 8 or 10 degrees.
• Reset (Scale) — resets the scale range for the temperature graph. Useful when the scale spans a
large range due to extreme temperature changes. Only shows if Log and Graph Scale is set to ‘Auto’.
• Log Duration — sets how fast or slow the temperature log scrolls; the shorter the time duration,
the faster the temperature log scroll. Select a duration from 1 minute to 2.5 hours.
Unit Operation
Main Menu Options
Main Menu - Temp Tab
Modifying a Data FieldData Field Setup screen
250C Manual.indd 18 1/27/2004, 3:55:11 PM