


62
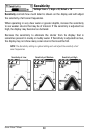
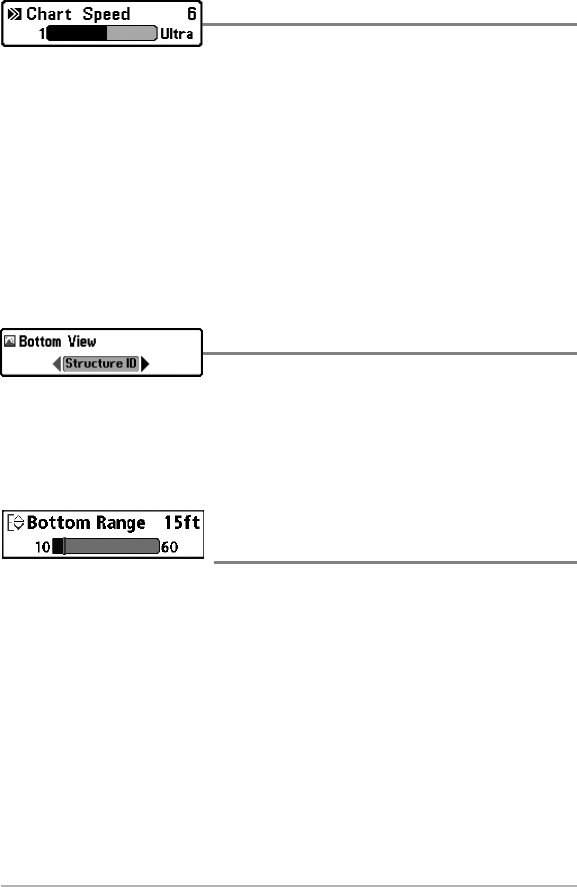
Chart Speed
Settings: 1-9, Ultra, where 1 = Slow, 9 = Fast, Ultra =
Fastest; Default = 5
Chart Speed determines the speed at which the sonar information moves across
the display, and consequently the amount of detail shown.
A faster speed shows more information and is preferred by most anglers;
however, the sonar information moves across the display quickly. A slower speed
keeps the information on the display longer, but the bottom and fish details
become compressed and may be difficult to interpret. Regardless of the Chart
Speed setting, the RTS Window™ will update at the maximum rate possible for
the depth conditions.
Bottom View
Settings: Inverse, Structure ID®, WhiteLine™, Bottom
Black; Default = Inverse
Bottom View selects the method used to represent bottom and structure on the
display. See What’s on the Sonar Display: Bottom Presentation for more
information.
Bottom Range
(Sonar Zoom View only when Bottom Lock is On)
Settings: 10 - 60 feet, 2-10 fathoms, or 3-20 meters
[International Models only], Default = 15 feet
Bottom Range allows you to control how much of the water column, measured
up from the bottom, is shown in the Sonar Zoom View. Choose a small value to
see low-lying bottom structure or details of the bottom return. Choose a larger
value to see large structure in deeper water.
NOTE: It is possible to set the Bottom Range to be greater than the depth. In this case,
you may see surface clutter in a wavy band that mirrors changes in the depth.
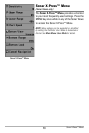
Sonar X-Press™ Menu