


5
the bottom. Depth Range is automatically selected to keep the bottom visible on the
display, although you can adjust it manually as well (see Sonar X-Press™ Menu). Five
additional Digital Readouts display information from optional-purchase accessories.
These information boxes can be customized to show only the information desired (see
Setup Menu Tab, Select Readouts).
NOTE: If the Depth number is flashing, it means that the unit is having trouble locating the
bottom. This usually happens if the water is too deep, the transducer is out of the water, the boat
is moving too fast, or for any other reason that the unit can’t accurately receive continuous data.
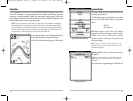
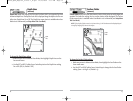
Understanding Sonar History
It is important to understand the significance of the Humminbird® display. The display
does NOT show a literal 3-dimensional representation of what is under the water. Each
vertical band of data received by the control head and plotted on the display represents
something that was detected by a sonar return at a particular time. As both the boat and
the targets (fish) may be moving, the returns are only showing a particular segment of
time when objects were detected, not exactly where those objects are in relation to
other objects shown on the display.
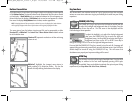
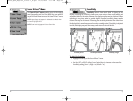
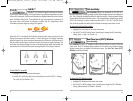
Real Time Sonar (RTS®) Window
A Real Time Sonar (RTS®) window appears on the right side of the display in the Sonar
View only. The RTS® Window always updates at the fastest rate possible for depth
conditions and shows only the returns from the bottom, structure and fish that are
within the transducer beam. The RTS® Window plots the depth and intensity of a sonar
return (see Sonar Menu - RTS® Window).
The Narrow RTS® Window
indicates the sonar intensity
through the use of colors.
Red indicates a strong
return and blue indicates a
weak return. The depth of
the sonar return is indicated
by the vertical placement of
the return on the display
depth scale.
The Wide RTS® Window
indicates the sonar intensity
through the use of a bar
graph. The length of the
plotted return provides an
indication of whether the
return is weak or strong. The
depth of the sonar return is
indicated by the vertical
placement of the return on
the display depth scale.
4
Views
The views available on your FishFinder are:
• Sonar View
• Zoom View
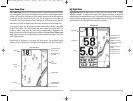
• Big Digits View.
Sonar View is the default view. When the VIEW key is pressed, the display cycles through
the available views. When the EXIT key is pressed, the display cycles through the
available views in reverse order. Any view can be hidden or displayed as part of the view
rotation using Select View from the Advanced Setup Menu.
NOTE: When you change any menu settings that affect the sonar, the view will update
immediately (i.e. you don’t have to exit the menu to apply the change to the screen).
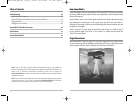
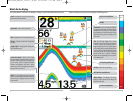
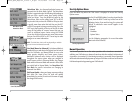
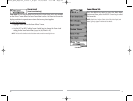
Sonar View
Sonar View presents a historical log of sonar returns. Depth is always displayed.
Readouts for temperature and speed are automatically displayed if the appropriate
accessory is connected. The most recent sonar returns are charted on the right side of
the window; as new information is received, the older information is moved
across the display to the left.
A Digital Depth Readout is displayed in the upper left corner. A scale with Upper and
Lower Depth Range readouts appears along the right edge of the Sonar View. The scale
indicates the distance from the surface of the water to a depth range sufficient to show
Upper Range
Depth
Temperature
Triplog w/
Temp/Speed
Speed w/
Temp/Speed
Lower Range
RTS® Window
FF585c_Man_English_531363-1_B.qxd 12/27/2004 8:33 PM Page 10