


© 2011 Schneider Electric. All Rights Reserved.
63230-500-225A2 PowerLogic
TM
Series 800 Power Meter
3/2011 Chapter 7—Logging
61
Alarm-driven Data Log Entries
The PM810 with a PM810LOG can detect over 50 alarm conditions, including over/under
conditions, digital input changes, phase unbalance conditions, and more. (See Chapter
6—Alarms on page 45 for more information.) Use PowerLogic software to assign each
alarm condition one or more tasks, including forcing data log entries into Data Log 1.
The PM820, PM850, and PM870 can detect over 50 alarm conditions, including over/under
conditions, digital input changes, phase unbalance conditions, and more. (See Chapter
6—Alarms on page 45 for more information.) Use PowerLogic software
to assign each
alarm condition one or more tasks, including forcing data log entries into one or more data
log files.
For example, assume you have defined three data log files. Using PowerLogic software,
you could select an alarm condition such as “Overcurrent Phase A” and set up the power
meter to force data log entries into any of the three log files each time the alarm condition
occurs.
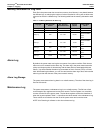
Organizing Data Log Files (PM850, PM870)
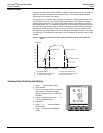
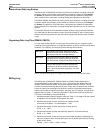
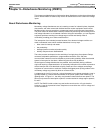
You can organize data log files in many ways. One possible way is to organize log files
according to the logging interval. You might also define a log file for entries forced by alarm
conditions. For example, you could set up three data log files as follows:
NOTE: The same data log file can support both scheduled and alarm-driven entries.
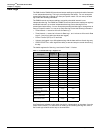
Billing Log
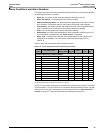
The PM810 with a PM810LOG, PM820, PM850 and PM870 Power Meters store a
configurable billing log that updates every 10 to 1,440 minutes (the default interval 60
minutes). Data is stored by month, day, and the specified interval in minutes. The log
contains 24 months of monthly data and 32 days of daily data, but because the maximum
amount of memory for the billing log is 64 KB, the number of recorded intervals varies
based on the number of registers recorded in the billing log. For example, using all of the
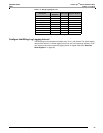
registers listed in Table 7–6, the billing log holds 12 days of data at 60-minute intervals.
This value is calculated by doing the following:
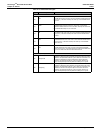
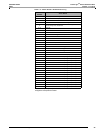
1. Calculate the total number of registers used (see Table 7–6 on page 63 for the number
of registers). In this example, all 26 registers are used.
2. Calculate the number of bytes used for the 24 monthly records.
24 records (26 registers x 2 bytes/register) = 1,248
3. Calculate the number of bytes used for the 32 daily records.
32 (26 x 2) = 1,664
4. Calculate the number of bytes used each day (based on 15 minute intervals).
96 (26 x 2) = 4,992
5. Calculate the number of days of 60-minute interval data recorded by subtracting the
values from steps 2 and 3 from the total log file size of 65,536 bytes and then dividing
by the value in step 4.
(65,536 – 1,248 – 1,664)
4,992 = 12 days
Data Log 1: Log voltage every minute. Make the file large
enough to hold 60 entries so that you could look
back over the last hour’s voltage readings.
Data Log 2: Log energy once every day. Make the file large
enough to hold 31 entries so that you could look
back over the last month and see daily energy use.
Data Log 3: Report by exception. The report by exception file
contains data log entries that are forced by the
occurrence of an alarm condition. See the topic
above, “Alarm-driven Data Log Entries”, for more
information.