Viewing measurements on the display
Panel Layout View(charts/graphs)
053-644, Rev H Page 45 eg4
Panel Layout View(charts/graphs)
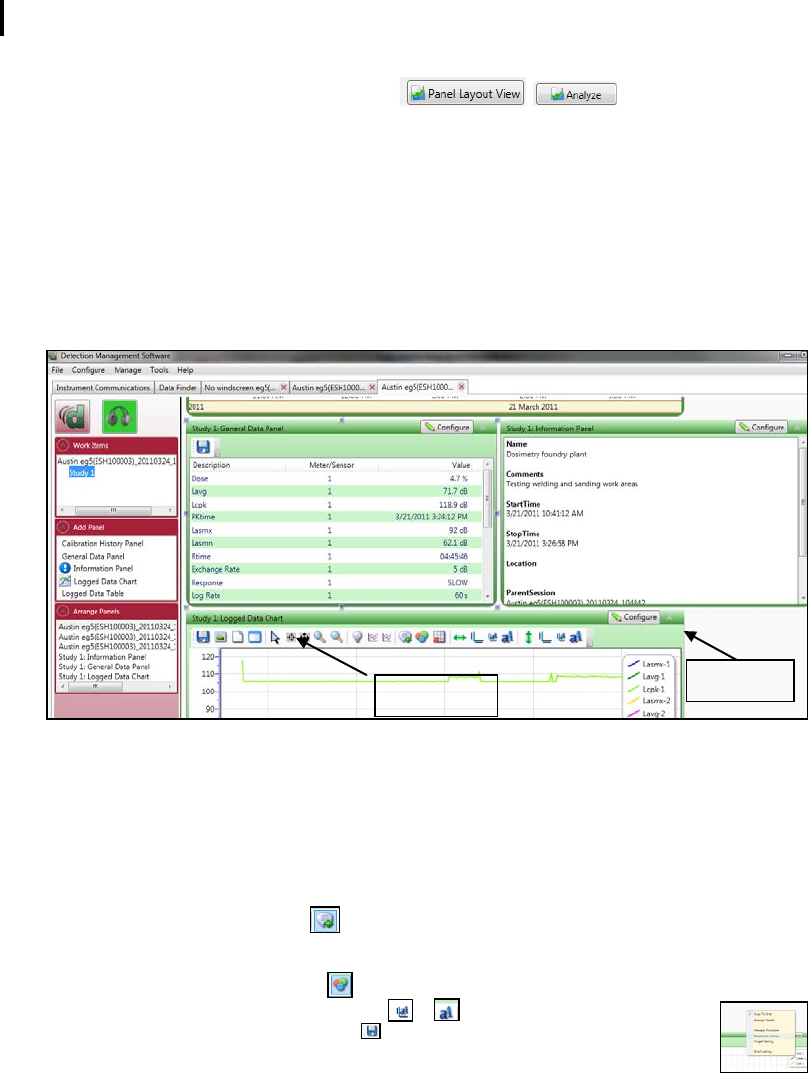
When you are in the data finder page (see above), select either the Analyze button or double-click on a
session/study to view the data in charts and graphs as displayed in Figure 5-7. The measurements and
parameters will be displayed in charts and graphs which may be customized for analysis and/or reporting
purposes.
1. In the panel layout view page, it is divided into Work Items (see 1), Add panel (see 2), Arrange Panels (see
3) and data panels (see 4).
• Work items (1) – select either the session or study (in order to view appropriate measurement/parameter data).
• Add panel (2) – double-click on a chart/table type and it will appear as a panel on your screen.
• Arrange panels (3) – displays the order of the sessions/studies displayed in the panel section of your screen.
• Data Panels (4) – used to view your measurement and/or parameters from your study. Note: use the menu bar icons
and/or configure icon to customize parameters.
Figure 5-7: Panel layout view (viewing the data in charts and graphs)
Quick tips with panels (charts/graphs)
• To stretch the graph, click on one the corner’s edge of a chart or table and drag the mouse. The graph will expand and
widened (depending on how you drag your mouse).
• To move the graph, click drag and drop to the appropriate panel position.
• To change ranges, when clicking on either the x-axis or y-axis, click and drag the mouse until the appropriate range is
selected. (Note: it will span the numbers up or down depending on how you drag the mouse.)
• To add labels, click on the add labels icon. Right-click and select edit text to add note/label on the chart. Type in
text and press the Enter key (on your keyboard). To move the label, left-click and hold to drag to appropriate location
on graph.
• To customize chart colors, click on the icon and using the properties box, select different colors as needed.
• To customize x or y axis font type, click on these or icons.
• To export data to .xls file, click on the export icon.
• To save a layout, right-click outside the tables/graphs area as displayed below. Click Remember Setting.
