


152
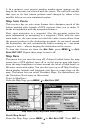
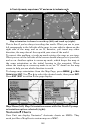
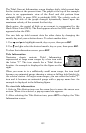
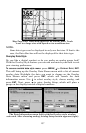
The Tidal Current Information screen displays daily tidal current data
for the station at the present time. The graph at the top of the example
above is an approximate view of the flood and ebb pattern from
midnight (MN), to noon (NN) to midnight (MN). The velocity scale at
the top left side of the graph changes dynamically based upon the
maximum velocity of the current for that day.
Slack water, the period of little or no current, is represented by the
Slack Water Line (SWL). The flood appears above the SWL and the ebb
appears below the SWL.
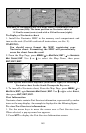
You can look up tidal current data for other dates by changing the
month, day and year selection boxes. To select another date:
1. Use → and ← to highlight month, day or year, then press
ENT.
2. Use ↑ and ↓ to select the desired month, day or year, then press
ENT.
To clear the information screen, press
EXIT.
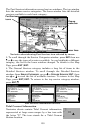
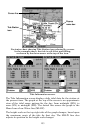
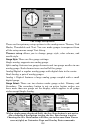
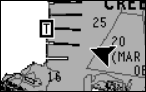
Tide Information
Navionics charts contain Tidal Information,
represented at large zoom ranges by a box icon with
the letter "T." The icon stands for a Tidal Station
location. An example is displayed in the figure on the
right.
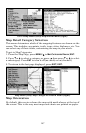
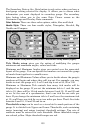
When you zoom in to a sufficiently small zoom range, the icon itself
becomes an animated gauge showing a rising or falling tidal height for
the selected station. At larger zoom ranges, you can select the boxed "T"
icon and it becomes an animated gauge with a pop-up name box. An
example is displayed in the following figure.
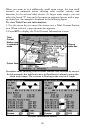
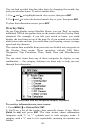
To view tide information:
1. Select a Tide Station icon: use the arrow keys to move the cursor over
an icon. When it is selected, a pop-up name box appears.
2. After selecting the Tide Station icon, press
WPT to display the Tide
Information screen.