


NOTE: The offshore Fishing chart is available with premium
charts, in some areas.
NOTE: Auto Guidance is available with premium charts, in
some areas.
1
From the Navigation chart or Fishing chart, select a location.
2
If necessary, select Select.
3
Select Navigate To.
4
Select an option:
• To navigate directly to the location, select Go To.
• To create a route to the location, including turns, select
Route To.
• To use Auto Guidance, select Guide To.
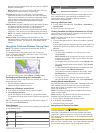
5
Review the course indicated by the magenta line.
NOTE: When using Auto Guidance, a gray segment within
any part of the magenta line indicates that Auto Guidance
cannot calculate part of the Auto Guidance line. This is due
to the settings for minimum safe water depth and minimum
safe obstacle height.
6
Follow the magenta line, steering to avoid land, shallow
water, and other obstacles.
Premium Charts
CAUTION
The Auto Guidance feature is based on electronic chart
information. That data does not ensure obstacle and bottom
clearance. Carefully compare the course to all visual sightings,
and avoid any land, shallow water, or other obstacles that may
be in your path.
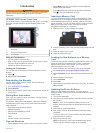
NOTE: Not all models support all charts.
Optional premium charts, such as BlueChart
®
g2 Vision
®
, allow
you to get the most out of your chartplotter. In addition to
detailed marine charting, premium charts may contain these
features, which are available in some areas.
Mariner’s Eye 3D: Provides a view from above and behind the
boat for a three-dimensional navigation aid.
Fish Eye 3D: Provides an underwater, three-dimensional view
that visually represents the sea floor according to the
information on the chart.
Fishing Charts: Shows the chart with enhanced bottom
contours and without navigational data. This chart works well
for offshore deep-sea fishing.
High Resolution Satellite Imagery: Provides high-resolution
satellite images for a realistic view of the land and water on
the Navigation chart (Showing Satellite Imagery on the
Navigation Chart).
Aerial Photos: Shows marinas and other navigationally
significant aerial photos to help you visualize your
surroundings (Viewing Aerial Photos of Landmarks).
Detailed Roads and POI data: Shows detailed road and point
of interest (POI) data, which includes highly detailed coastal
roads and POIs such as restaurants, lodging, and local
attractions.
Auto Guidance: Uses specified safe depth, safe height, and
chart data to determine the best course to your destination.
Auto Guidance is available when you navigate to a
destination using Guide To.
Viewing Tide Station Information
on the chart indicates a tide station. You can view a detailed
graph for a tide station to help predict the tide level at different
times or on different days.
NOTE: This feature is available with premium charts, in some
areas.
1
From the Navigation chart or Fishing chart, select a tide
station.
Tide direction and tide level information appear near .
2
Select an option to view additional station information:
• Select the station name.
• If more than one item is in the vicinity, select Review, and
select the station name.
Animated Tide and Current Indicators
NOTE: This feature is available with premium charts, in some
areas.
You can view indicators for animated tide station and current
direction on the Navigation chart or the Fishing chart. You must
also enable animated icons in the chart settings (Showing and
Configuring Tides and Currents).
An indicator for a tide station appears on the chart as a vertical
bar graph with an arrow. A red arrow pointing downward
indicates a falling tide, and a blue arrow pointing upward
indicates a rising tide. When you move the cursor over the tide
station indicator, the height of the tide at the station appears
above the station indicator.
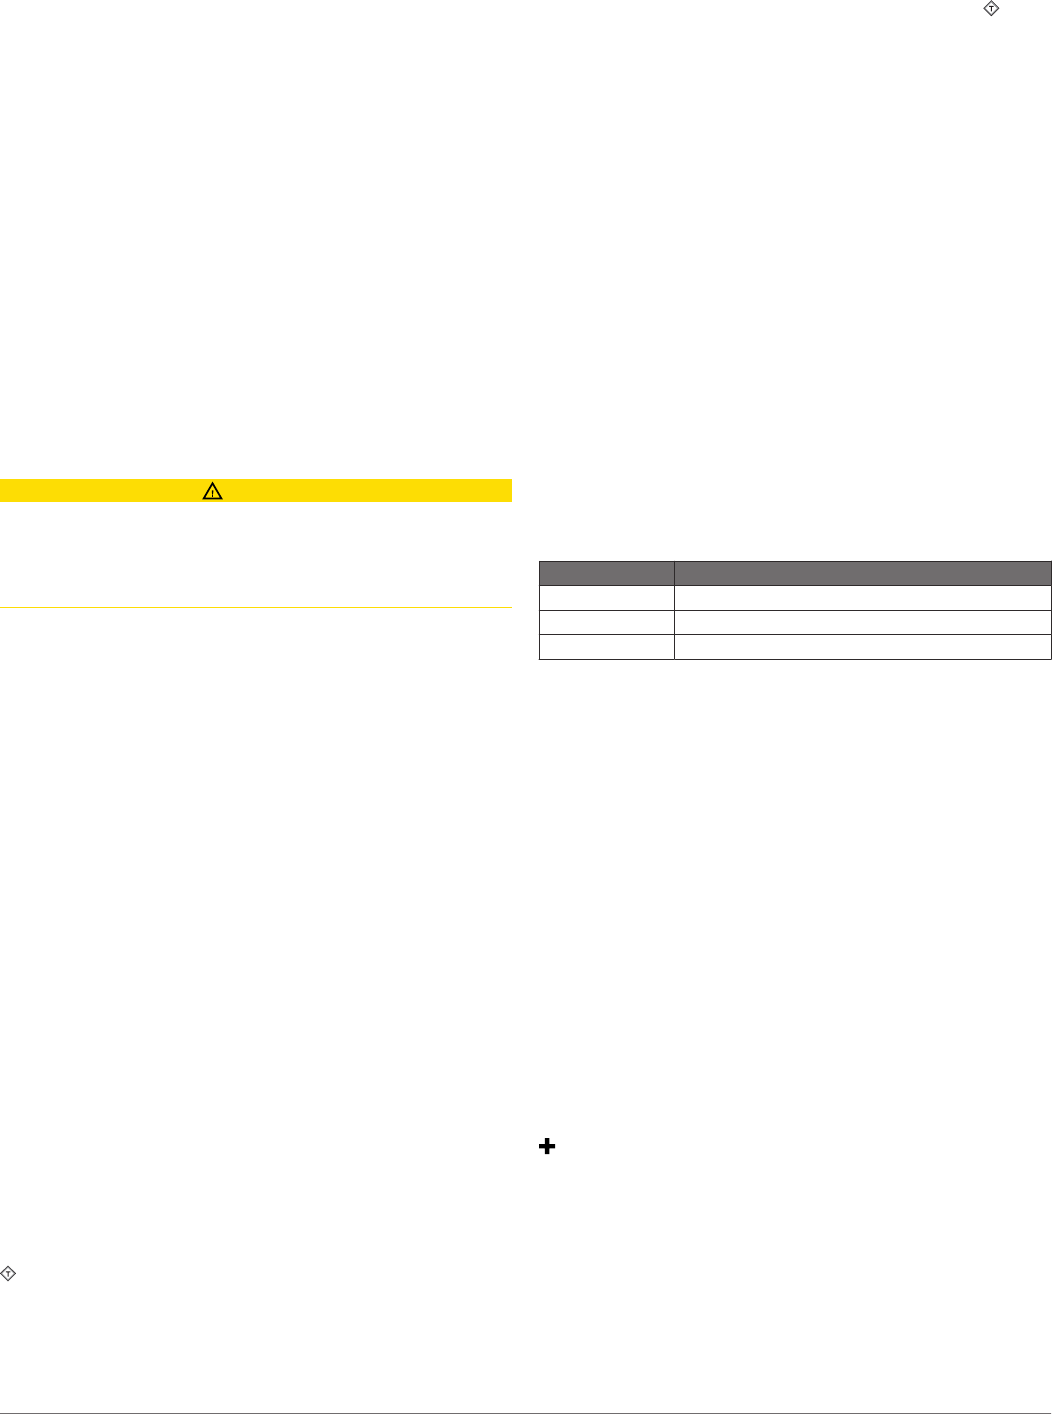
Current direction indicators appear as arrows on the chart. The
direction of each arrow indicates the direction of the current at a
specific location on the chart. The color of the current arrow
indicates the range of speed for the current at that location.
When you move the cursor over the current direction indicator,
the specific current speed at the location appears above the
direction indicator.
Color Current Speed Range
Yellow 0 to 1 knot
Orange 1 to 2 knots
Red 2 or more knots
Showing and Configuring Tides and Currents
NOTE: This feature is available with premium charts, in some
areas.
You can show static or animated tide and current station
indicators on the Navigation chart or Fishing chart.
1
From the Navigation or Fishing chart, select Menu > Chart
Menu > Chart Setup > Tides & Currents.
2
Select an option:
• To show current station indicators and tide station
indicators on the chart, select On.
• To show animated tide station indicators and animated
current direction indicators on the chart, select Animated.
Showing Satellite Imagery on the Navigation Chart
NOTE: This feature is available with premium charts, in some
areas.
You can overlay high-resolution satellite images on the land or
on both land and sea portions of the Navigation chart.
NOTE: When enabled, high-resolution satellite images are
present only at lower zoom levels. If you cannot see high-
resolution images in your optional chart region, you can select
to zoom in. You also can set the detail level higher by
changing the map zoom detail.
1
From the Navigation chart, select Menu > Chart Menu >
Chart Setup > Satellite Photos.
2
Select an option:
• Select Land Only to show standard chart information on
the water, with photos overlaying the land.
• Select Photo Map to show photos on both the water and
the land at a specified opacity. Use the slider bar to adjust
the photo opacity. The higher you set the percentage, the
more the satellite photos cover both land and water.
4 Charts and 3D Chart Views