


Pausing the Sonar Display
From a Sonar view, select Menu > Sonar Menu > Pause
Sonar.
Viewing Sonar History
You can scroll the sonar display to view historical sonar data.
1
From a sonar view, select Menu > Sonar Menu > Pause
Sonar.
2
Drag the screen or use the arrow keys.
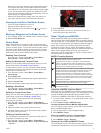
Sonar Sharing
This feature may not be available on all chartplotter models.
You can view the sonar data from all compatible sources on the
Garmin Marine Network. You can view sonar data from a
compatible external sonar module, such as a GCV™ sonar
module. In addition, you can view the sonar data from other
chartplotters that have a built-in sonar module.
Each chartplotter on the network can display sonar data from
every compatible sonar module and transducer on the network,
no matter where the chartplotters and transducers are mounted
on your boat. For example, from the GPSMAP 8212 mounted at
the back of the boat, you can view the sonar data from an
echoMAP™ 70dv mounted at the front of your boat.
Chartplotters can only display sonar types they are compatible
with. For example, the echoMAP 50dv and GPSMAP 547 can
display traditional and DownVü data, but not SideVü data.
When sharing sonar data, the values of some sonar settings,
such as Range and Gain are synchronized across the devices
on the network. The values of other sonar settings, such as the
Appearance settings, are not synchronized and should be
configured on each individual device. In addition, the scroll rates
of the various traditional and DownVü sonar views are
synchronized to make the split views more cohesive.
NOTE: Using multiple transducers simultaneously can create
cross talk, which can be removed by adjusting the Interference
sonar setting.
Selecting a Sonar Source
This feature may not be available with all models.
When you are using more than one sonar data source for a
particular sonar view, you can select the source to use for that
sonar view. For example, if you have two sources for DownVü,
you can select the source to use from the DownVü sonar view.
1
Open the sonar view for which you will change the source.
2
Select Menu > Sonar Menu > Sonar Setup > Source.
3
Select the source for this sonar view.
Renaming a Sonar Source
You can rename a sonar source to easily identify that source.
For example, you use "Bow" as the name of the transducer on
the bow of your boat.
The source is renamed for the present view only. For example,
to rename the DownVü sonar source, you must open the
DownVü sonar view.
1
From the sonar view, select Menu > Sonar Menu > Sonar
Setup > Source > Rename Sonar Source.
2
Enter the name.
Adjusting the Level of Detail
You can control the level of detail and noise shown on the sonar
screen either by adjusting the gain for traditional transducers, or
by adjusting the brightness for DownVü and SideVü/DownVü
transducers.
If you want to see the highest intensity signal returns on the
screen, you can lower the gain or brightness to remove lower
intensity returns and noise. If you want to see all return
information, you can increase the gain or brightness to see
more information on the screen. This also increases noise, and
can make it more difficult to recognize actual returns.
1
From a sonar view, select Menu > Sonar Menu.
2
Select Gain or Brightness.
3
Select an option:
• To increase or decrease the gain or brightness manually,
select Up or Down.
• To allow the chartplotter to adjust the gain or brightness
automatically, select an automatic option.
Adjusting the Color Intensity
You can adjust the intensity of colors and highlight areas of
interest on the sonar screen by adjusting the color gain for
traditional transducers or the contrast for DownVü and SideVü/
DownVü transducers. This setting works best after you have
adjusted the level of detail shown on the screen using the gain
or brightness settings.
If you want to highlight smaller fish targets or create a higher
intensity display of a target, you can increase the color gain or
contrast setting. This causes a loss in the differentiation of the
high intensity returns at the bottom. If you want to reduce the
intensity of the return, you can reduce the color gain or contrast.
1
From a sonar view, select Menu > Sonar Menu.
2
Select an option:
• While in the DownVü or SideVü sonar view, select
Contrast.
• While in another sonar view, select Sonar Setup >
Advanced > Color Gain.
3
Select an option:
• To increase or decrease the color intensity manually,
select Up or Down.
• To use the default setting, select Default.
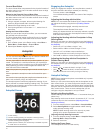
Adjusting the Range of the Depth or Width
Scale
You can adjust the range of the depth scale traditional and
DownVü sonar views and the range of the width scale for the
SideVü sonar view.
Allowing the device to adjust the range automatically keeps the
bottom within the lower or outer third of the sonar screen, and
can be useful for tracking a bottom that has minimal or
moderate terrain changes.
Manually adjusting the range enables you to view a specified
range, which can be useful for tracking a bottom that has large
terrain changes, such as a drop-offs or cliffs. The bottom can
appear on the screen as long as it appears within the range you
have set.
1
From a sonar view, select Menu > Sonar Menu > Range.
2
Select an option:
• To allow the chartplotter to adjust the range automatically,
select Auto.
• To increase or decrease the range manually, select Up or
Down.
TIP: From the sonar screen, you can select or to
manually adjust the range.
Setting the Zoom Level on the Sonar Screen
1
From a sonar view, select Menu > Sonar Menu > Zoom.
2
Select an option:
• To zoom in on the sonar data from the bottom depth,
select Bottom Lock.
Sonar 13