


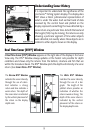
9
Understanding Sonar History
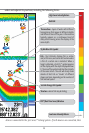
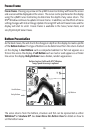
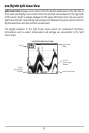
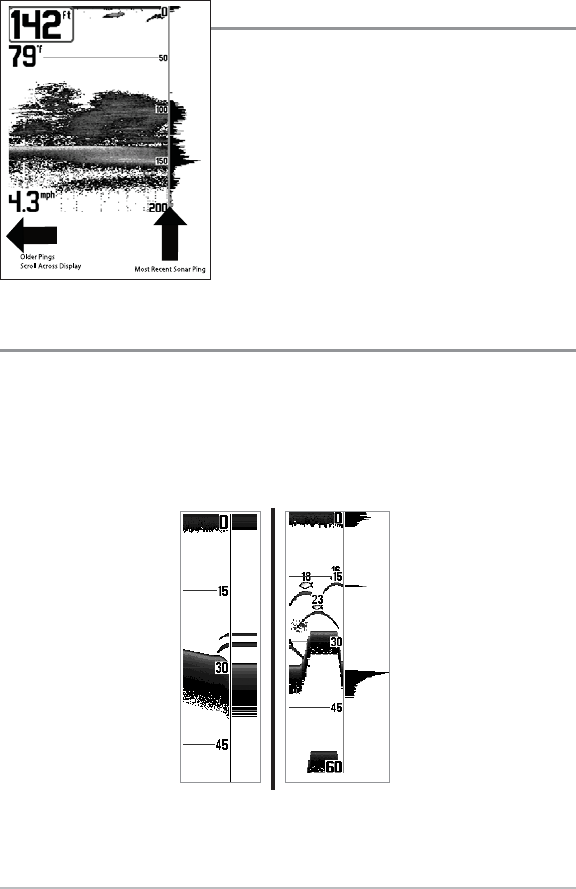
It is important to understand the significance of the
300 Series™ Fishing System display. The display does
NOT show a literal 3-dimensional representation of
what is under the water. Each vertical band of data
received by the control head and plotted on the
display represents something that was detected by a
sonar return at a particular time. As both the boat and
the targets (fish) may be moving, the returns are only
showing a particular segment of time when objects
were detected, not exactly where those objects are in
relation to other objects shown on the display.
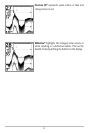
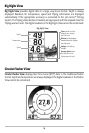
Real Time Sonar (RTS®) Window
A Real Time Sonar (RTS®) Window appears on the right side of the display in the Sonar
View only. The RTS® Window always updates at the fastest rate possible for depth
conditions and shows only the returns from the bottom, structure and fish that are
within the transducer beam. The RTS® Window plots the depth and intensity of a sonar
return. (See Sonar Menu: RTS® Window) .
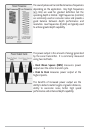
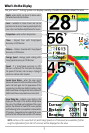
The Narrow RTS® Window
indicates the sonar intensity
through the use of colors.
Red indicates a strong
return and blue indicates a
weak return. The depth of
the sonar return is indicated
by the vertical placement of
the return on the display
depth scale.
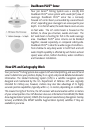
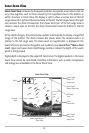
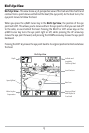
The Wide RTS® Window
indicates the sonar intensity
through the use of a bar
graph. The length of the
plotted return provides an
indication of whether the
return is weak or strong. The
depth of the sonar return is
indicated by the vertical
placement of the return on
the display depth scale.