


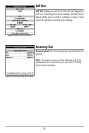
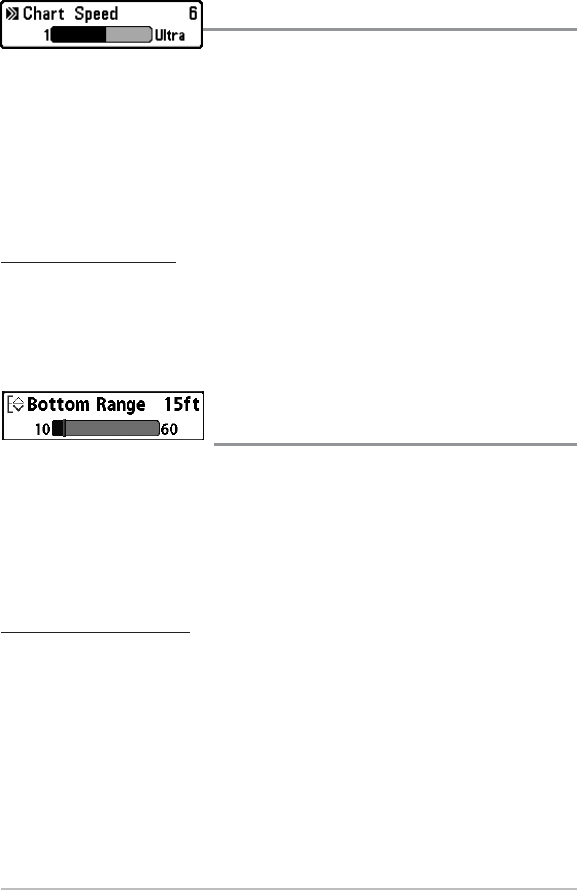
Chart Speed
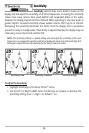
Chart Speed determines the speed at which the sonar
information moves across the display, and consequently the amount of detail shown. A
faster speed shows more information in the Sonar Views and is preferred by most
anglers; however, the sonar information moves across the display quickly. A slower
speed keeps the information on the display longer, but the bottom and fish details
become compressed and may be difficult to interpret. Regardless of the Chart Speed
setting, the RTS® Window will update at the maximum rate possible for the depth
conditions. Adjust Chart Speed to your personal preference.
To adjust the Chart Speed:
1. Highlight Chart Speed on the Sonar X-Press™ menu.
2. Use the LEFT or RIGHT 4-WAY Cursor Control keys to increase or decrease the Chart
Speed setting. (1-9, Ultra, where 1 = Slow, 9 = Fast, Ultra = Fastest, Default = 5)
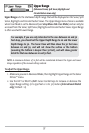
Bottom Range
(Sonar Zoom view only when Bottom Lock is On)
Bottom Range allows you to control how much of the water column, measured up from
the bottom, is shown in the Sonar Zoom View. Choose a small value to see low-lying
bottom structure or details of the bottom return. Choose a larger value to see large
structure in deeper water. It is possible to set the Bottom Range to be greater than the
depth. In this case, you may see surface clutter in a wavy band that mirrors changes in
the depth.
To adjust the Bottom Range:
1. In the Sonar Zoom View, highlight Bottom Range on the Sonar X-Press™ menu.
2. Use the LEFT or RIGHT 4-WAY Cursor Control keys to change the Bottom
Range setting. (10 - 60 feet or 3-20 meters [International Models only],
Default = 15 feet)
39