


13
MODEL FCL-1056 SECTION 4.0
DISPLAY AND OPERATION
SECTION 4.0
DISPLAY AND OPERATION
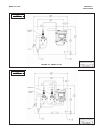
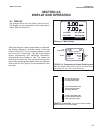
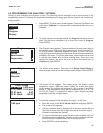
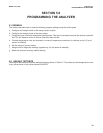
When the analyzer is being programmed or calibrated,
the display changes to a screen similar to the one
shown in Figure 4-2. The live readings appear in small
font at the top of the screen. The rest of the display
shows programming and calibration information.
Programming items appear in lists. The screen can
show only four items at a time, and the arrow bar at the
right of the screen indicates whether there are additional
items in the list. See Figure 4.3 for an explanation of the
arrow bar.
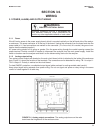
4.1. DISPLAY
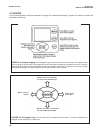
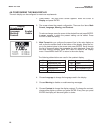
The analyzer has a four line display. See Figure 4-1.
The display can be customized to meet user require-
ments. Refer to section 4.6.
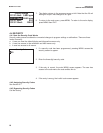
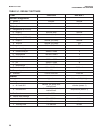
FIGURE 4-3. Arrow Bar.
The arrow bar shows whether
additional items in a list are available.
You are at the top of the
list. There are more items
for viewing. Scroll down.
You are at the bottom of the
list. There are more items
for viewing. Scroll up.
You are in the middle of the
list. There are more items for
viewing. Scroll up or down.
FIGURE 4-1. Main Display
1. ppm
7. pH
Warning
T1: 25.0
q
C
T2: 25.0
q
C
O1: 12.00 mA
O2: 12.00 mA
Warning
FIGURE 4-2. Programming Screen Showing Item
List. The position of the cursor is shown in reverse video.
See Section 4.2 and 4.3 for more information.
Warning
1.00 ppm 25.0C
7.00 pH 25.0C
Output 1 Configure
Assign: S1 Measurement
Range: 4-20 mA
Scale: Linear
Dampening: 0 sec
Live
measurement
Item list
Arrow
bar