


0:THH
t;
H'
j/
'yL
j/'11
if,
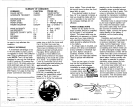
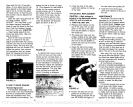
FIGURE
40
graph
record becomes coarse
and
the
ability
to
separate
fish from the
bottom or from other fish will
be
decreased.
(See Figure
41 &
42.)
Therefore,
the lower
the
suppression setting,
the
better.
Increase the
Suppressor
setting
only
as far as
necessary
to
remove the
erratic,
unwanted
noise marks.
Most of the time at
low or
trolling
speeds,
no
suppression
will be
necessary.
To use the
Suppressor, simply
press
the desired
amount of
suppression
desired,
from 0 to 7,
and then
press
the 2nd
key
and
the 9
key.
For
example,
if
you
wanted
to increase the
suppression
level to
5,
then
you
would
press:
5
-
2nd
-
9,
in that
order.
When
any Suppressor
level
other
than 0 is
chosen,
the level is
printed
on
the bottom line of
the
chart
paper.
For
example,
if the
suppressor
level is set to
5,
then
the X-16
will
print:
SUP=5.
The
only disadvantage
to
this
system
is that
resolution,
or the
ability
to
separate targets,
is
diminished
when the
pulse
length
is increased.
A 200
is
(micro-
second)
transmitter
pulse
length
used
on the X-16 when
power
is
first
turned
on,
will allow
the unit
to
display
two fish or
targets
that
are
only
6 inches
apart.
In other
words,
if two fish that
are 6 inches
apart
are
displayed
on the
graph
paper, they
will show
up
as two
separate
arches
when the trans-
mitter is
operating
with a 200
ps
pulse
length.
Now,
if we increase
the transmitter's
pulse
length
to
400
ps, (by
increasing
the
Sup-
pressor)
those
same two fish
arches will blend
together
and
show
up
as
one fish or
possibly
even
a 'blob" on the
paper.
With a 400
is transmit
pulse
width,
those
same two fish will
have to be at
least 12 inches
apart
before
they
will show
up
as two
separate
arches
on the
graph.
This is
why
it is
important
to leave
the
Suppressor
control turned
20
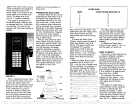
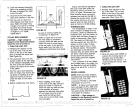
256.OFT 01 LOIJRAIICE
256.OFT
FIGURE
13
UPPER LIMIT
Many
times
it is desirable to
expand
a section of the area that
is
displayed
on the
graph
recorder
to show
more detail. This is made
possible by
the X-16 to show
segments
of the underwater world
by using
the UPPER LIMIT func-
tion.
Using
the UPPER LIMIT
key
allows
you
to
display any depth
range
at
the
top
of the chart
paper.
Example:
Turn on unit and set
range
to 20
-
60 feet.
Press: 2
-
0
-
UPPER LIMIT
Press: 6
-
0
-
LOWER LIMIT
20.0
-
—--
---20,0
-:
23.0--
— —-----—-
-
-28.0
36.0
——---
— -
36.0
44.0-—
--—— —-—
44.0
52.0
—---—
—
66.2
61.2-—-
_ —— —-
66.6-
-
?2.OFT
---
31-—
—-
LPMCE
—
72.PFT—
FIGURE
15
The
Upper
and
Lower Limits
can be used
in various combina-
tions to
show
segments
from the
surface to the
bottom and
any-
where in
between. A one foot
segment
of
the
depth
can be
displayed
at
any
time,
if desired.
Representative
samples
of chart
paper
are
shown in the back of
this
manual.
If
you
wish to
display your depth
settings
at
any
time,
simply
press
the 2nd
key
and then the SCALE
key.
The current
range
will be
printed
on the
paper immediately.
This
will not
change
the
depth
selling.
NOTE:
Although
the
maximum
lower
limit of the
depth
range
is
8000
feet,
the actual
depth
that
the
X-16 will reach is
dependent
on water
conditions,
bottom
condi-
tions,
and the
quality
of the
transducer installation.
Typically,
the X-16 will reach
a
depth
of
approximately
1000 feet
without a
power
booster. You
may get
more
or
less
depending
on conditons.
LINES
When the X-16 is first
turned
on,- depth
lines will
be
printed
on
the
paper.
If
you
desire
to turn the
Lines
off,
press
the
LINES
key.
To
turn the lines back
on, press
the
LINES
key again.
-on ___0.0
l;f
'F'?Ii1irr;ç, flr!il..6!r1j!jI!!!I
0.0
l,O
—
-
-51.2
—-
51.2—
—- --
50.4
-
102.4—--—
—-—--——--—-———
102.4
653.6
——
153.6--
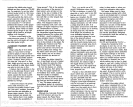
FIGURE 42 SIJPPRESSION:TOOHIGH
— —-- ——
204.0
--
-.
—-,- \...
-'
-
,
'
ekF
'4,':
$'SWC
c
-
r
' ''1
''
4rzrr—"
OURAIICE
FIGURE 41
PROPER
SETFING
I.
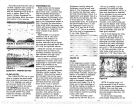
60.6 FT
——
21
----——----
LOURAIICE
—- -—--
60.0 FT
-
FIGURE 14
Example:
Set
range
to 45
-
72
feet.
Press: 4
-
5
-
UPPER LIMIT
Press:
7
-
2
-
LOWER LIMIT
9
PDF compression, OCR, web-optimization with CVISION's PdfCompressor