


Page 40 CP180 / CP180i
Caution
Red when “Guardian Technology” detects cautionary or restricted area.
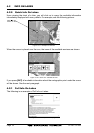
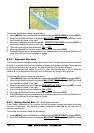
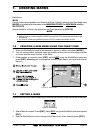
6.0.4 Currents Prediction
It is possible to see the variation of the Tidal arrows on the selected area at any given time.
To activate this function follow the procedure:
1. Press [MENU]. Move the ShuttlePoint knob to highlight
SETUP MENU and press [ENT].
2. Move the ShuttlePoint knob to highlight
MAX FUNCTIONS and press [ENT] or move
the ShuttlePoint knob to the right.
3. Move the ShuttlePoint knob to highlight
CURRENTS PREDICTION and press [ENT] or
move the ShuttlePoint knob to the right.
4. A window is shown on the low-left side of the chart. Press [ENT] to set the date and time
manually, and [GOTO]/[MENU] to decrease/increase time; press [CLR] to exit.
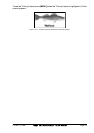
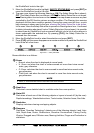
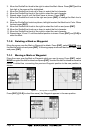
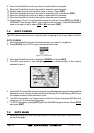
6.0.5 Pictures & Diagrams
Using C-Map MAX data cards allows you to show pictures or diagrams on the chart plotter
display. These Pictures are typically used to facilitate the identification of cartographic
objects or places around the map: they can be the landscape layout nearby a harbor, the
shape of a bridge or of a buoy etc.
On some objects, such as bridges, the image associated can represent the Diagram
representing the shape of the objects and the various characteristics (length, height, type
of bridge etc.).
Figure 6.0.5 - Pictures and Diagrams
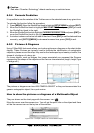
The pictures or diagrams can be a MULTIMEDIA OBJECT or they can be associated to a
generic cartographic object, like a port marina.
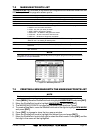
How to show the pictures or diagrams of a Multimedia Object
They are shown on the chart page with the camera icon
Move the cursor over the camera icon. You will get the quick info on the object and there
will be the camera icon on the top bar of the window:
Figure 6.0.5a - Example of Quick Info on MULTIMEDIA object