5HIHUHQFH0DQXDO
00809-0100-4811, Rev AA
October 2002
Rosemount 3300 Series
6-14
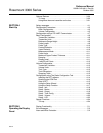
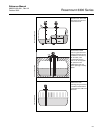
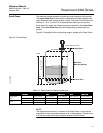
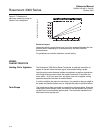
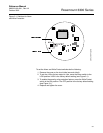
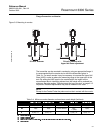
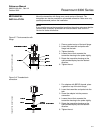
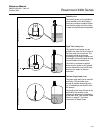
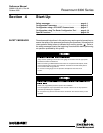
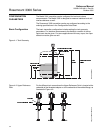
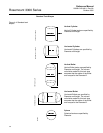
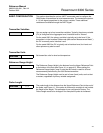
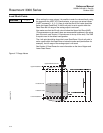
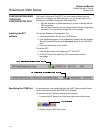
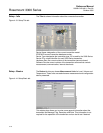
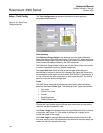
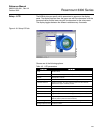
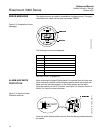
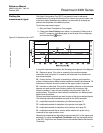
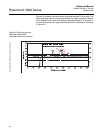
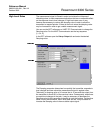
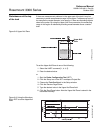
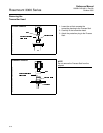
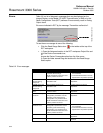
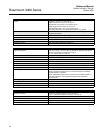
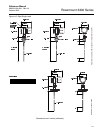
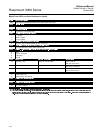
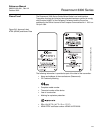
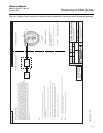
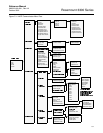
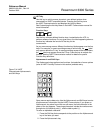
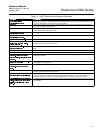
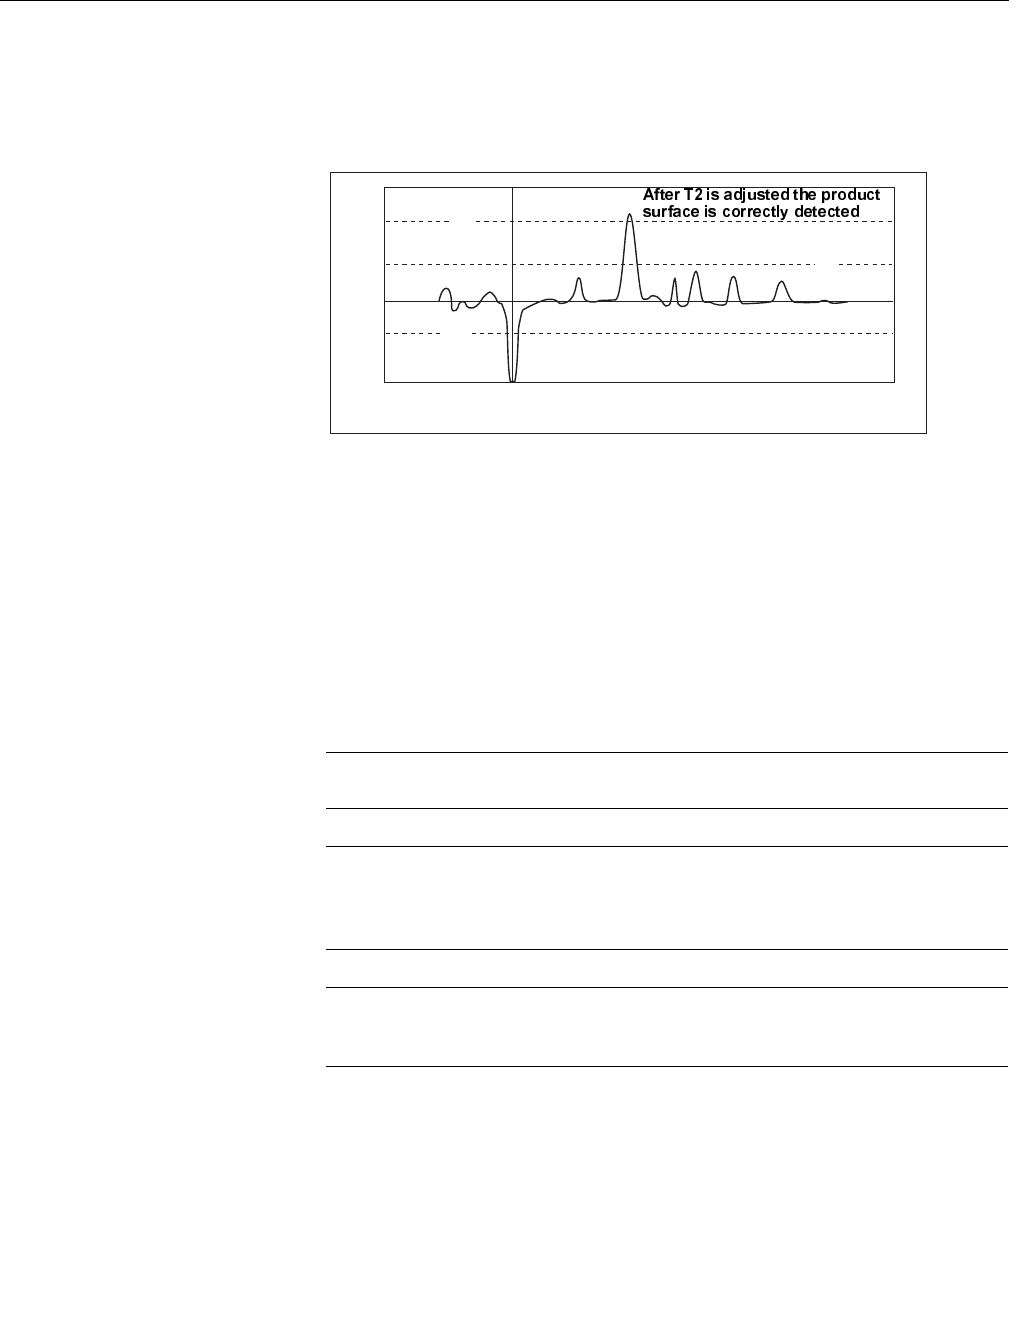
By adjusting the amplitude threshold T2 the product surface is detected
correctly as illustrated in Figure 6-12.
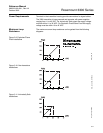
Figure 6-12. Waveform plot after
threshold T2 was adjusted
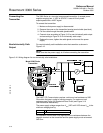
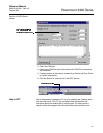
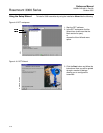
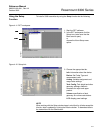
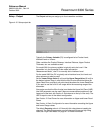
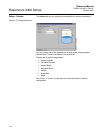
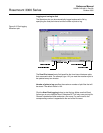
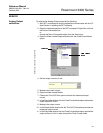
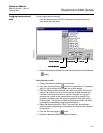
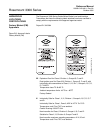
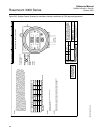
To adjust the amplitude thresholds select HART command [1, 4, 6, 2]
or
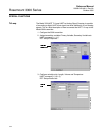
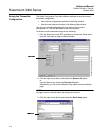
1. Start the Radar Configuration Tool (RCT).
2. Choose the 'HYLFH&RPPDQGV option from the View menu.
3. Open the 'HWDLOV folder.
4. Click the 6HW1RPLQDO7KUHVKROGVoption.
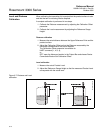
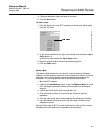
The thresholds T2 and T3 should be set to about 50% of the measured signal
amplitude for the product surface and the interface peaks, respectively.
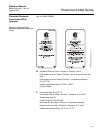
127(
Amplitude thresholds should not be set to values less than 3.
127(
Check that the dielectric constant parameter setting is reasonably close to the
actual dielectric constant value of the upper product before changing the
amplitude thresholds.
127(
Default Amplitude thresholds can be set by typing 0 as the new threshold
value.
P1
P2
T1
T2
T3
Amplitude
Distance (samples)
100
80
60
-60
40
-40
20
-20
0
0 100 200 300 400 500 600
100
50
0
150
200
250
WAVEFORMPLOT THRESHOLD ADJUSTED