


Fluke 192/196/199
Users Manual
28
Plotting Measurements Over Time
(TrendPlot™)
Use the TrendPlot function to plot a graph of Scope or
Meter measurements as function of time.
Note
Because the navigations for the dual input
TrendPlot (Scope) and the single input TrendPlot
(Meter) are identical, only TrendPlot (Scope) is
explained in the next sections.
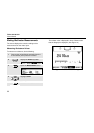
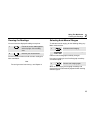
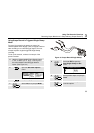
Starting a TrendPlot Function
To start plotting a graph of the reading over time, do the
following:
1 Apply a signal to the red BNC input A and turn
on Reading 1 in scope mode
2 Open the RECORDER main menu.
3 Highlight Trend Plot (Scope).
4 Start the TrendPlot recording.
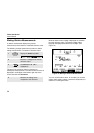
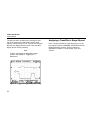
The test tool continuously records the digital readings of
the input A measurements and displays these as a graph.
The TrendPlot graph rolls from right to left like a paper
chart recorder.
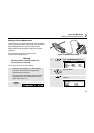
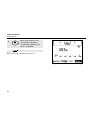
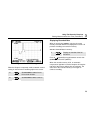
Observe that the recorded time from start appears at the
bottom of the screen. The present reading appears on
top of the screen. (See Figure 17.)
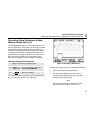
Note
When simultaneously TrendPlotting two
readings, the screen area is split into two
sections of four divisions each.