


7
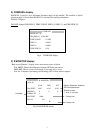
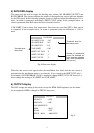
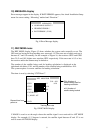
The display consists of four indications; a circular graph which shows direction where the
tracking error rate is the highest, a bar graph which shows tracking error rates in 12
directions, mutlipath indexes, and elapsed time.
Circular graph: Shows the relation of 12 directions to the bow. The direction of the highest
tracking error rate and its opposite direction are painted. Note that the sectors are painted even
when no heading loss problem occurs.
Bar graph: Shows tracking error rate in 12 directions. The bar number corresponds to the
sector number. The longer the bar, the more the error occurs. The blockage of the satellite
signal by surrounding may cause the tracking error. Note that the sector opposite to the
obstacle may have the longest bar.
Multipath indexes: Shows the effect of the multipath reflection. It is around 1.0 normally. If it
is 1.5 or above, the antenna must be relocated, because the system is affected by the multipath
reflection. The left figure is the index for the baseline 2 (antennas 1 and 3) and the right one
for the baseline 1 (antennas 1 and 2).
Elapsed time: Shows how long the data is collected. The timer starts at first power up after
installation and counts up to 99 hours and 59 minutes (99:59). No measurements are made
after 99 hours 59 minutes. Allow the system 12 hours or more to collect the data in various
satellite configurations because the satellite configuration has little change within 12 hours.
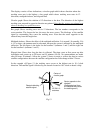
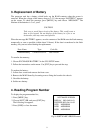
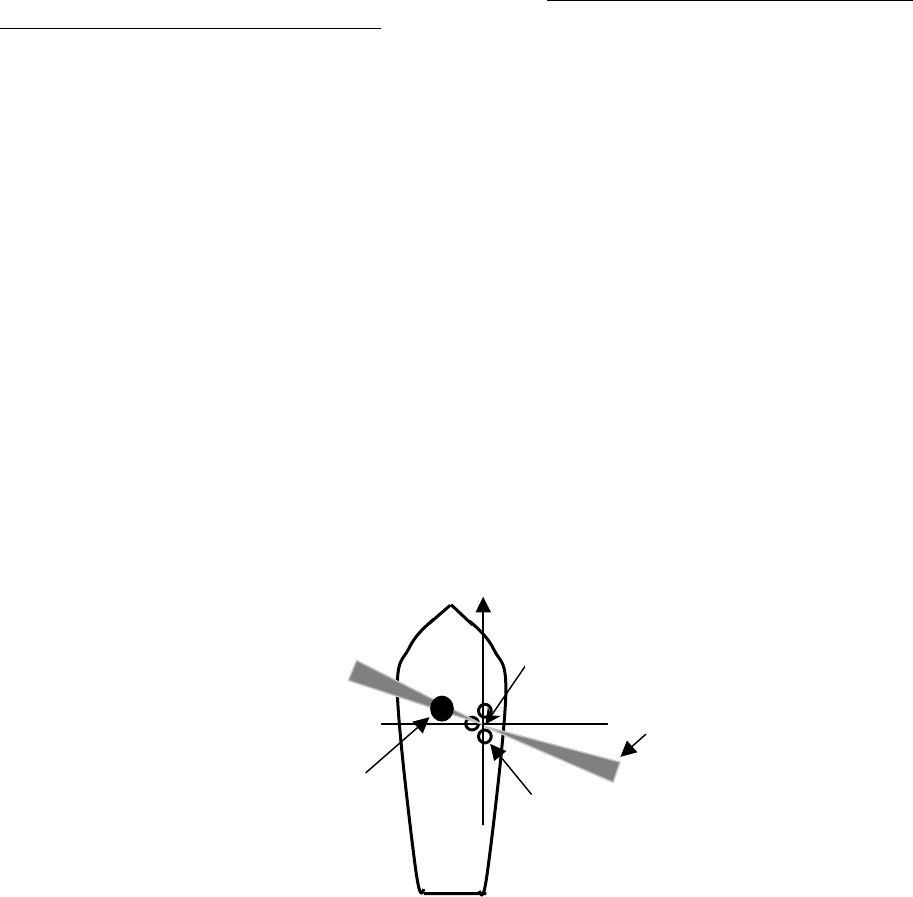
In the example of Figure 13, the tracking error occurs at the highest rate in 10 o’clock
direction. The satellite signal is blocked by an obstacle located at 10 o’clock on board a ship.
Fig.13
SC-50/110
antennas
Obstacle blocking
satellite signal
Center of
circular graph
Sector opposite to the
obstacle
(Reflected signal from
the obstacle may cause
the tracking error.)