


32
On the WaterOn the Water
Understanding the Chart
Understanding the Chart
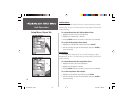
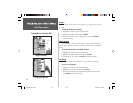
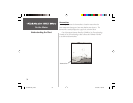
It is important to understand that the unit does not display a 3-D
representation of the underwater environment. The unit can display mul-
tiple things at the same time, but cannot determine from where the return
originated. It can only determine when the return was received.
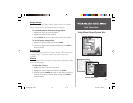
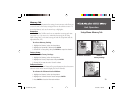
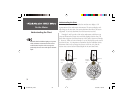
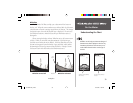
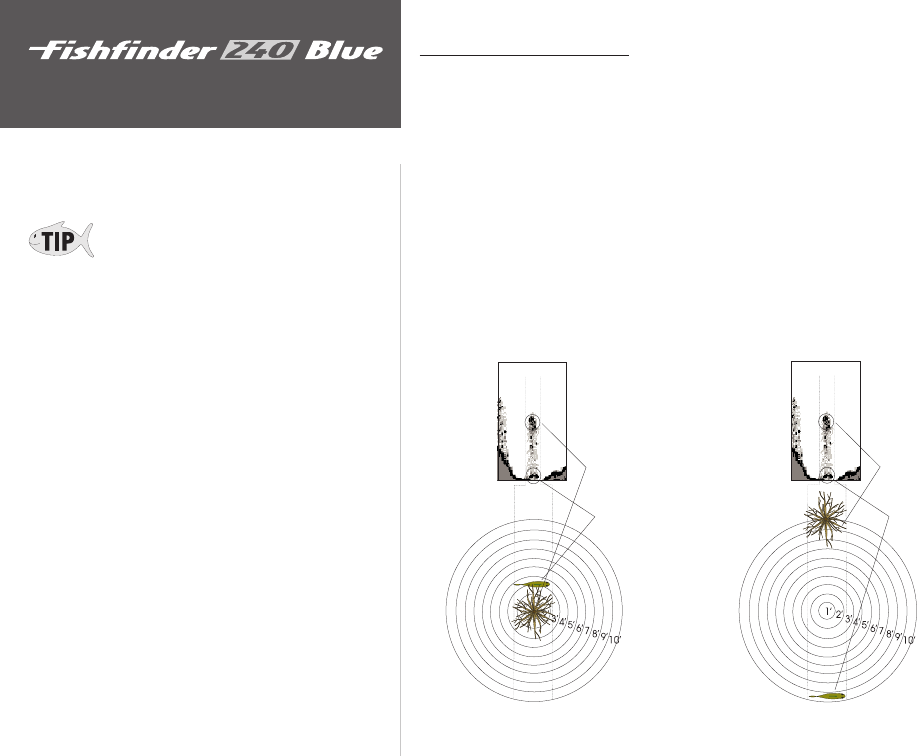
Examples 1 and 2 provide a look at the underwater world from a top
view, and illustrate how these views would be displayed on the chart. On
both charts it appears the fi sh and tree are side by side as shown in Example
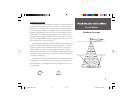
1. However, when we look at Example 2, we see that the fi sh can be several
feet from the tree. It is important to remember that the Fishfi nder cannot
determine where in the coverage area the tree or fi sh are, only that the
returns were received at the indcated depths in the same time frame.
Example 1.
Remember that the Fishfi nder displays a 2-D picture
of the underwater environment. T he fi sh and tree
could be located anywhere in the coverage area
produced by the sonar cone at the object’s indicated
depth.
Branches
Fish
Branches
Fish
Enlarged
Transducer
View
Example 2.
Enlarged
Transducer
View
190-00200-00_B.indd 02/19/02, 11:30 AM32