


6. ECDIS Overview
6-2
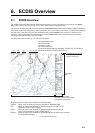
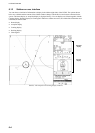
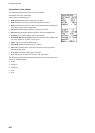
Electronic chart area
The ECDIS can use the two types of charts: S57ed3 ENC charts (vector) and CM-93 charts (vector)
The following information can also be displayed:
1. Cursor (moved by trackball)
2. Planned route
3. EBL (Electronic Bearing Line) and VRM
4. Own ship symbol with speed vector
The ECDIS combines chart and navigational information. It should be noted that modern navigation systems (e.g.,
differential GPS) may offer more accurate positioning than what was used to position some of the surveys from
which the electronic navigational chart was derived.
S57 vector format
ECDIS is compatible with S57 release 3 ENC format charts. From this format the ECDIS generates the "system
ENC", = SENC, which is used for actual operations of the ECDIS.
When opening a chart it is displayed with the default scale called the compilation scale. The details for the chart are
displayed in the electronic chart area and these can be modified. You can change the chart scale with the ZOOM IN
and ZOOM OUT functions, and the scale range is 1:1,000 - 1:50,000,000.
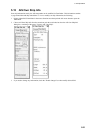
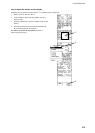
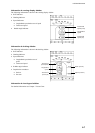
6.1.1 User interface
The user interface is defined as the areas that are not displaying the electronic chart.
The user interface contains information about settings, parameters and selections used by ECDIS. The nature of the
information displayed can be either static (such as name of a certain window, fields in chart legend, units, etc.) or
dynamic (such as position of own ship, time, user selections, etc.).
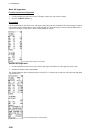
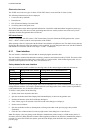
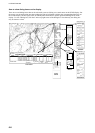
Color palettes for the user interface
There are several color palettes available for choosing colors for the chart background and information areas.
Setting Background color of chart Background color of information area
Day Bright Light-blue White
Day Blue Light-blue Dark-blue
Dusk Blue Black
Dusk Blue Blue Dark-blue
Night Dark-blue Black
With any palette selection except Day Bright, static text from dynamic text is shown in different colors to help you
distinguish between them. For example, dynamic data like own ship position, time or direct control of parameters
(scale, predictor time, etc.) is shown in yellow color.
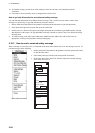
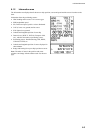
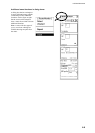
To choose a color palette, do the following:
1. Set the cursor in the electronic chart area.
2. Spin the scrollwheel until Chart Display/Info/Standard Display is shown in the guidance area.
3. Push the left button to open the Chart Display dialog box.
4. If the "Chart" page is not selected, click an arrow tab in the dialog box to display it.
5. Put the cursor on Palette.
6. Spin the scrollwheel to choose desired palette, referring to the table on the previous page, then push the
scrollwheel.
7. Click the Close window button (X) at the top right corner of the dialog box to close the box.
Note: The display colors may change to the Windows standard color palette whenever a USB memory device is
inserted or removed. (When Windows initiates USB recognition procedures, the Windows standard color palette is
restored.) To restore the ECDIS color palette, open the Chart Display menu and follow the procedure on the
previous page.