


35
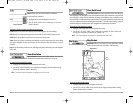
Bottom View
Bottom View selects the method used to represent bottom
and structure on the display. Structure ID® represents weak returns in blue and strong returns
in red. WhiteLine® highlights the strongest sonar returns in white resulting in a distinctive
outline. This has the benefit of clearly defining the bottom on the display. See Bottom
Presentation for more information.
T
o adjust the Bott
om View:
1. Highlight Bottom View on the Sonar X-Press™ Menu.
2. Use the LEFT or RIGHT 4-WAY Cursor Control keys to change the Bottom View setting.
(Structure ID, WhiteLine, Default = Structure ID)
34
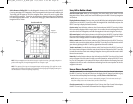
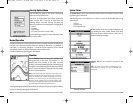
Lower Range
Lower Range sets the deepest depth range that will be displayed.
Automatic is the default setting. When in automatic mode, the lower range will be adjusted by
the unit to follow the bottom. Selecting a specific setting locks the depth range into Manual mode.
Use both Upper and Lower Range together to view a specific depth range manually when looking
for fish or bottom structure. will be displayed in the lower right corner of the screen when you
start manually adjusting the Lower Range to indicate that you are in Manual mode.
NOTE: A minimum distance of 10 feet will be maintained between the Upper and Lower Range
regardless of the manual settings entered.
To adjust the Lower Range:
1. Highlight Lower Range on the Sonar X-Press™ Menu.
2. Use the LEFT or RIGHT 4-WAY Cursor Control keys to increase or decrease the Lower
Range setting. (AUTO, 10 to 1000 feet, 3 to 330 meters [International Models Only],
Default = AUTO)
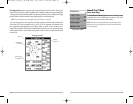
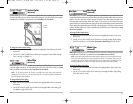
Chart Speed
Chart Speed determines the speed at which the sonar
information moves across the display, and consequently the amount of detail shown. A faster
speed shows more information in the Sonar Views and is preferred by most anglers; however, the
sonar information moves across the display quickly. A slower speed keeps the information on the
display longer, but the bottom and fish details become compressed and may be difficult to
interpret. Regardless of the Chart Speed setting, the RTS® Window will update at the maximum
rate possible for the depth conditions. Adjust Chart Speed to your personal preference.
T
o adjust the Chart Speed:
1. Highlight Chart Speed on the Sonar X-Press™ Menu.
2. Use the LEFT or RIGHT 4-WAY Cursor Control keys to increase or decrease the Chart Speed
setting. (1-9, Ultra, where 1 = Slow, 9 = Fast, Ultra = Fastest, Default = 4)
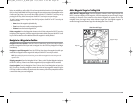
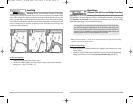
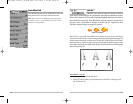
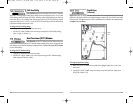
For example, if you are fishing in 60 feet of water but are only interested in
the first 30 feet (surface to a depth of 30 feet) you should set the Lower
Depth Range limit to 30. The display will show the 0 to 30 foot range,
allowing you to see a more detailed view than you would see if the display
went all the way to the bottom.
M
FF595_Man_531385-1_A_PrfE.qxd 12/9/2004 2:41 PM Page 40