


9
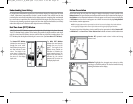
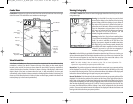
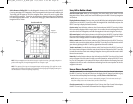
Bottom Presentation
As the boat moves, the unit charts the changes in depth on the display to create a profile of the
Bottom Contour. The type of bottom can be determined from the return charted on the display. A
Hard Bottom such as compacted sediment or flat rock appears as a thinner line across the display.
A Soft Bottom such as mud or sand appears as a thicker line across the display. Rocky Bottoms
have a broken, random appearance.
NOTE:A sloping bottom will be represented as a thicker line across the display. Also, harder bottoms
will be typically displayed with red and softer bottoms will be typically displayed with blue.
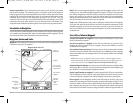
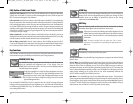
The sonar returns from the bottom, structure and fish can be represented as either Structure ID®
or WhiteLine®. See Sonar X-Press™ Menu: Bottom View for details on how to set the bottom view.
Structure ID® represents weak returns in blue and strong
returns in red.
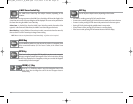
WhiteLine® highlights the strongest sonar returns in white,
resulting in a distinctive outline. This has the benefit of clearly
defining the bottom on the display.
8
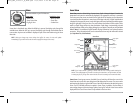
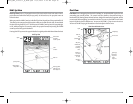
Understanding Sonar History
It is important to understand the significance of the FishFinder display. The display does NOT show
a literal 3-dimensional representation of what is under the water. Each vertical band of data
received by the control head and plotted on the display represents something that was detected
by a sonar return at a particular time. As both the boat and the targets (fish) may be moving, the
returns are only showing a particular segment of time when objects were detected, not exactly
where those objects are in relation to other objects shown on the display.
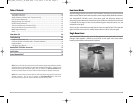
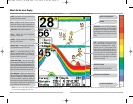
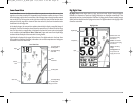
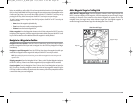
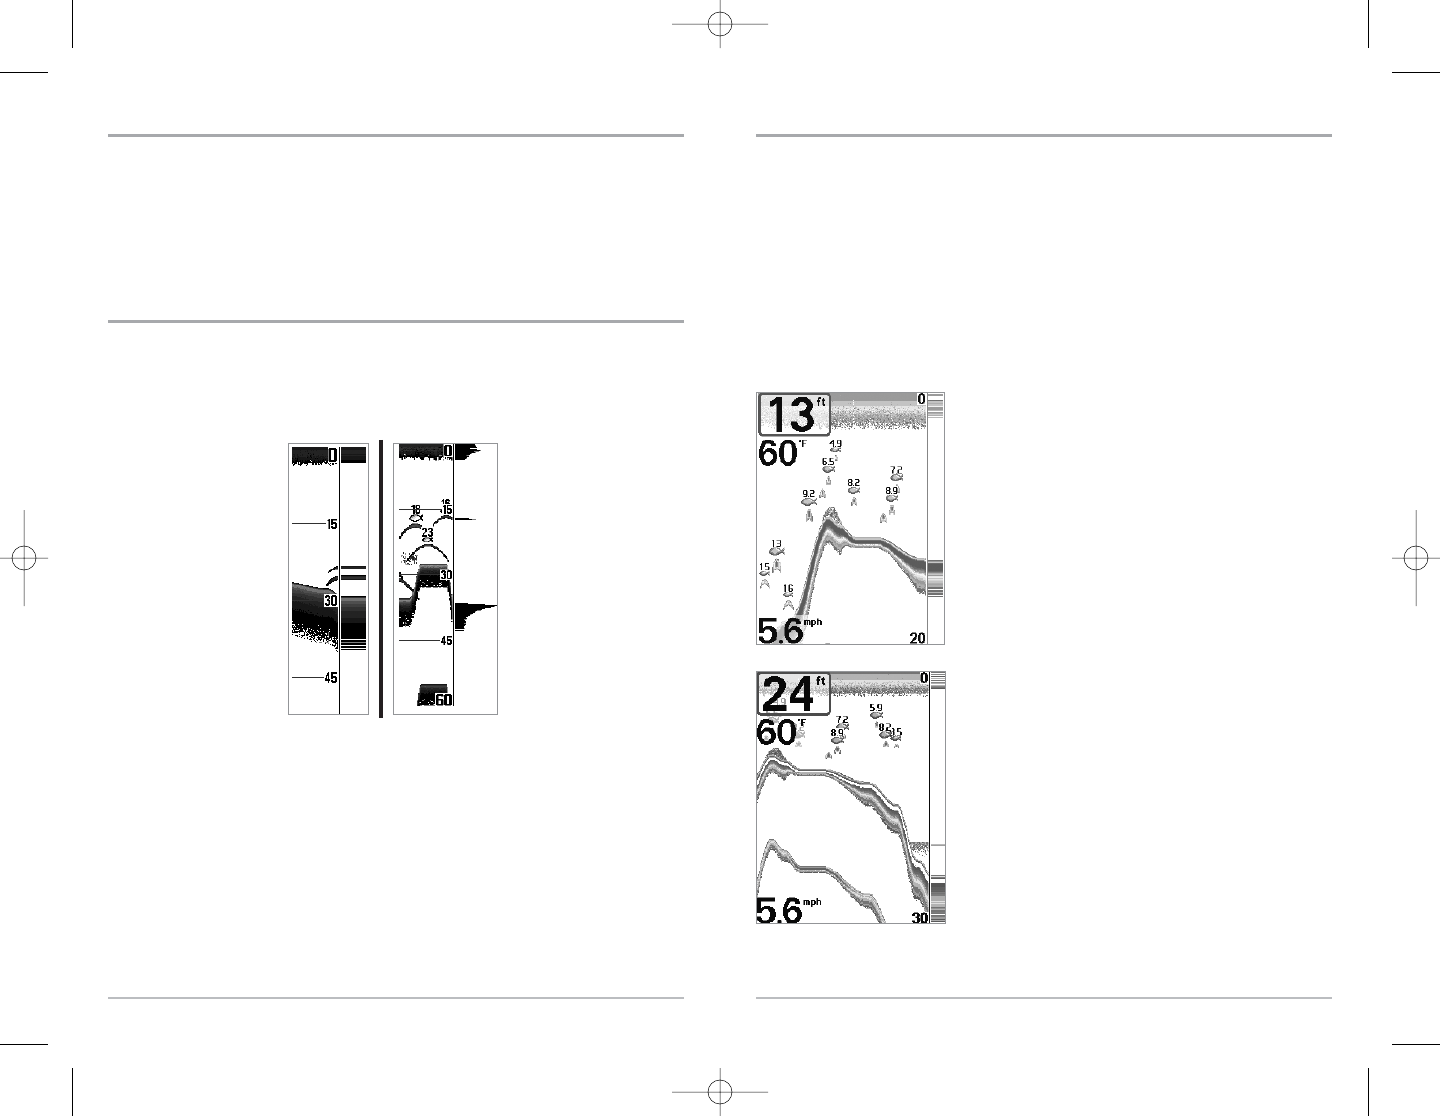
Real Time Sonar (RTS®) Window
A Real Time Sonar (RTS®) Window appears on the right side of the display in the Sonar View only.
The RTS® Window always updates at the fastest rate possible for depth conditions and shows
only the returns from the bottom, structure and fish that are within the transducer beam. The
RTS® Window plots the depth and intensity of a sonar return. (See Sonar Menu: RTS® Window).
The Narrow RTS® Window
indicates the sonar intensity
through the use of colors.
Red indicates a strong return
and blue indicates a weak
return. The depth of the
sonar return is indicated by
the vertical placement of
the return on the display
depth scale.
The Wide RTS® Window
indicates the sonar intensity
through the use of a bar
graph. The length of the
plotted return provides an
indication of whether the
return is weak or strong. The
depth of the sonar return is
indicated by the vertical
placement of the return on
the display depth scale.
FF595_Man_531385-1_A_PrfE.qxd 12/9/2004 2:40 PM Page 14