


14
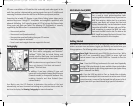
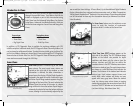
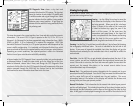
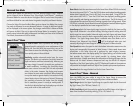
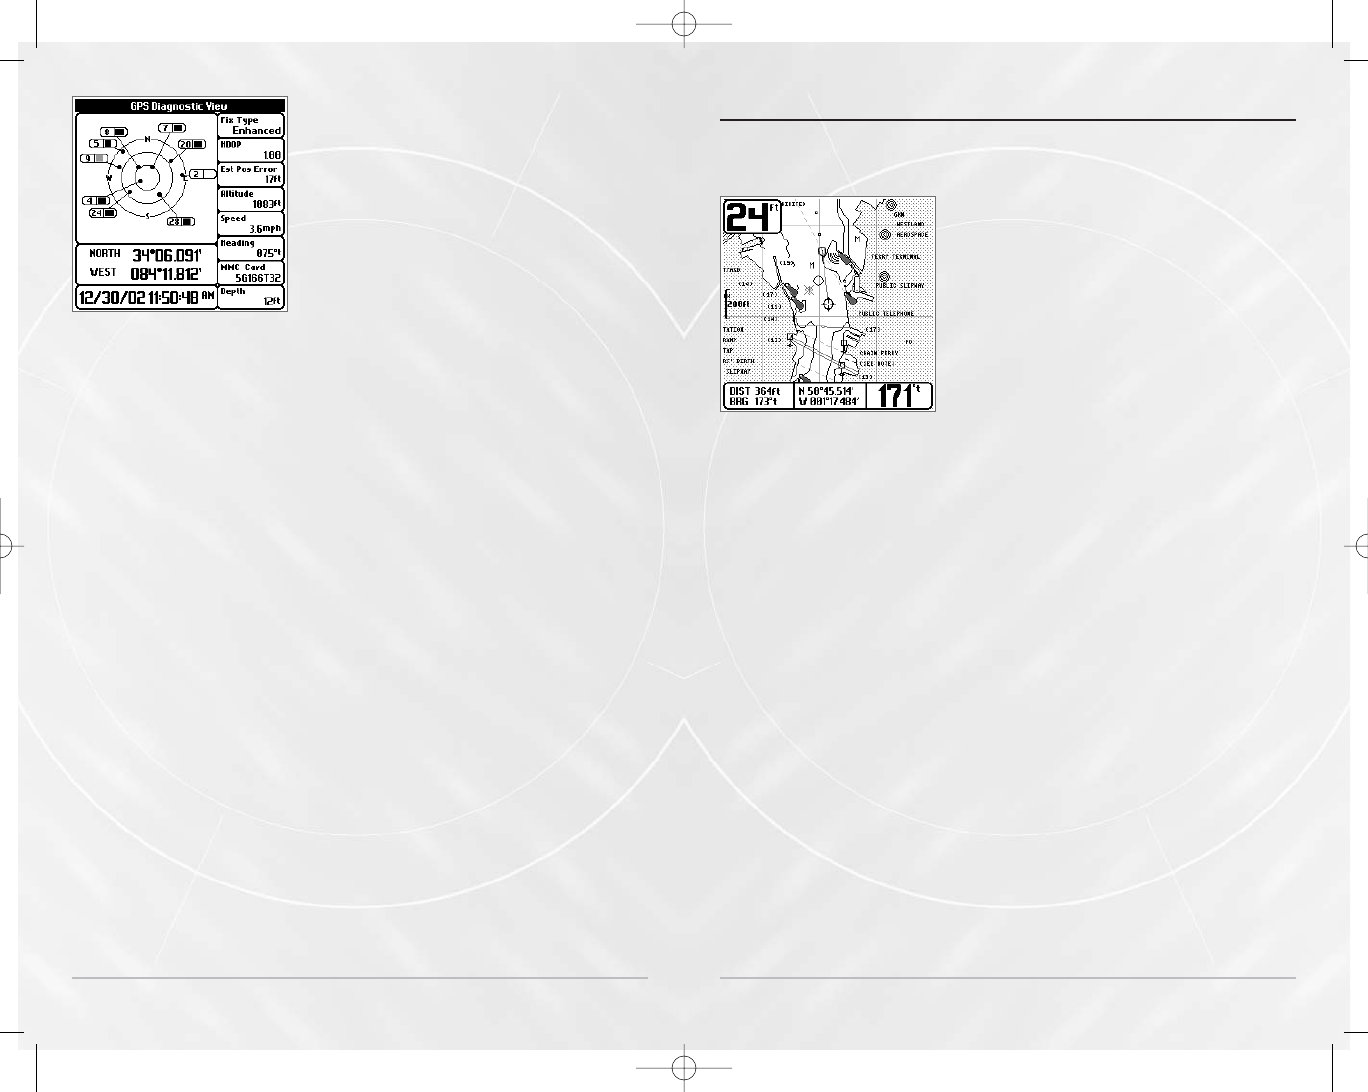
GPS Diagnostic View shows a sky chart and
numerical data from the GPS receiver. The sky chart
shows the location of each visible GPS satellite with
its satellite number and a signal strength bar. A dark
grey bar indicates that the satellite is being used to
determine your current position. A light gray bar
indicates that the satellite is being monitored, but is
not yet being used.
This view also reports the current position, local time and date, and other numeric
information. The current GPS Fix Type is reported as No Fix, 2D Fix, 3D Fix, or
Enhanced. An Enhanced fix has been augmented using information from WAAS,
EGNOS, or MSAS. A 3D or Enhanced Fix is required for navigation. HDOP (the
Horizontal Dilution of Precision) is a GPS system parameter which depends on the
current satellite configuration. It is translated into Estimated Position Error, which
gives an estimate of how far the reported position can be from your actual location.
Depending on current conditions, the reported position is within the Estimated
Position Error of your actual location with 68% probability.
In Normal mode, the GPS Diagnostic View is normally hidden, but can be viewed as
an Advanced feature. To make this view visible, go to the Setup Tab, set the User
Mode to Advanced, choose Select Views, and change the GPS Diagnostic View
selection to Visible. After this, the GPS Diagnostic View will become part of the view
rotation accessed through the VIEW key. See System Start-Up and Installation
Confirmation for more information about how to use this view.
GPS Diagnostic View
Viewing C
Viewing C
ar
ar
t
t
ogr
ogr
aph
aph
y
y
In the Chart or Combo Views, there are several cartography-related functions that
you can access using various keys.
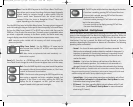
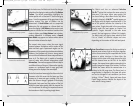
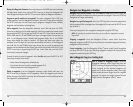
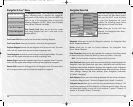
Panning – Use the 4-Way Cursor keys to move the
chart around on the display in the direction of the
key being pressed. When you do this, a bullseye
cursor is drawn at the center of the screen and
is linked to the boat by a gray line, even if the
boat is off the screen. At the same time, the
temperature and speed boxes in the lower left
corner are replaced with the distance and bearing
from the boat to the cursor position and the
latitude/longitude coordinates of the cursor.
Zooming - Use the Plus (+) key to Zoom In and the Minus (-) key to Zoom Out showing
the cartography at different scales. The scale is indicated on the left side of the
display. If you zoom in beyond the available chart data, the display will go into
Overzoom mode whereby the last available chart data is amplified to reflect the
scale selected.
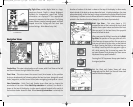
Chart Info - Use the INFO key to get detailed information about the chart. If the
cursor is active, you will see information about the chart objects located near the
cursor. If the cursor is not active, the Chart Info menu will appear. You can select the
nearest port, the nearest tide station, or the nearest current station to see
information about any of these objects.
Nearest Port – The position and services information for the nearest port to your
present position will be displayed. Press the EXIT key to remove the information box
and the cursor bull’s eye will be centered over the port position. The cursor
information boxes at the bottom of the display will indicate the distance and
bearing to the port from your present position.
Nearest Tide Station – Tide information for the nearest tide station to your present
position will be displayed. This includes the position of the station, the date used for
determining the tide information, and the times of the high and low tides for that
date. A tide graph is also displayed showing the rise and fall of the tides for the 24
Chart View with Cursor Present
15
M5565_ManE_531192-1_A.qxd 5/4/2003 9:39 PM Page 18