


10
As the boat moves, the Matrix unit charts the changes
in depth on the display to create a profile of the Bottom
Contour. The default presentation highlights the
bottom profile with a Structure ID® feature and gray
tones. From the appearance of the gray tones in the
bottom contour, the type of bottom can be
determined. A Hard Bottom such as compacted
sediment or flat rock appears as a thinner dark line
across the display. A Soft Bottom such as mud or sand
appears as a thicker line that contains a transition from
darker to lighter grays. Rocky Bottoms have a broken,
random appearance. In shallower water, a Second
Sonar Return may appear as a bottom contour below
the main bottom at twice the depth.
The second return occurs when the sonar signal
bounces between the bottom and the surface of the
water and back again. Experienced anglers use the
appearance of the second return to determine bottom
hardness. Hard bottoms will show a strong second
return, while soft bottoms will show a very weak one or
none at all. The Matrix unit is capable of revealing
layers of water with different temperatures called
thermoclines. Thermoclines appear at different depths
and different times of the year. A thermocline typically
appears as a continuous band of many gray levels
moving across the display at the same depth.
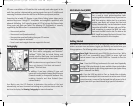
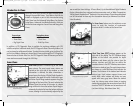
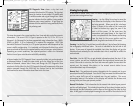
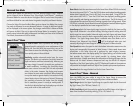
Due to the transducer beam angle, the distance to a fish
decreases as the fish moves into the beam, and then
increases as it moves out again, creating a Fish Arch
when this distance change is graphed on the display.
Boat speed, chart speed, and the position of the fish
within the sonar beam greatly affect the shape of the
arch. For optimum fish arching, it is important to mount
the transducer so that it is pointing straight down.
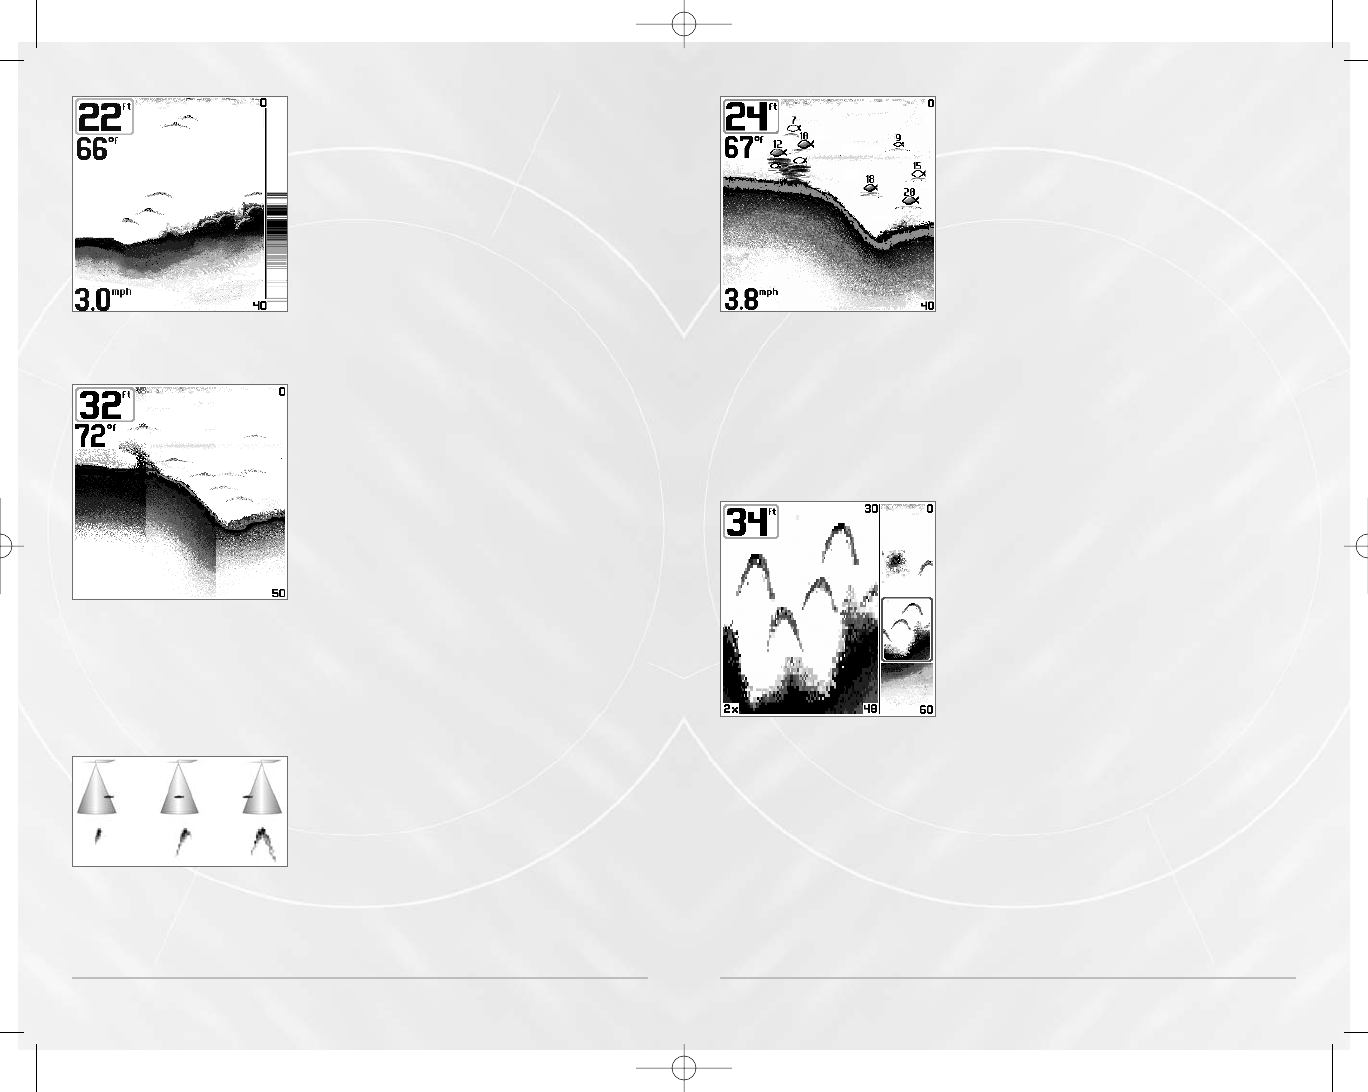
Transducer Cone and Fish Arches
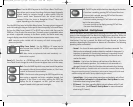
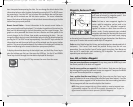
The Sensitivity can be adjusted to display
bottom contour and thermoclines.
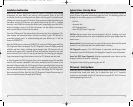
Bottom Contour Profile with RTS® Window.
Temp/Speed Accessory is optional.
11
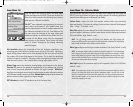
The Matrix unit has an advanced Selective
Fish ID+
TM
option that analyzes the sonar return to
determine if the sonar return may contain fish
(see Sonar Settings - Main Menu Sonar Tab). When
a target is detected, a Fish ID+
TM
symbol appears on
the display with the depth associated with it. The
size of the symbol indicates the intensity of the
sonar return. Targets detected in the narrow beam
directly under the boat appear as Shaded Fish
Symbols. Targets detected in the wide beam
around the boat appear as Hollow Fish Symbols.
The Matrix unit will clearly show schools of Bait
Fish as "clouds" of different shapes and sizes,
depending on the number of fish and boat speed.
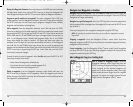
Sonar Zoom View increases the display resolution to
separate sonar returns that are very close together,
such as those caused by fish suspended close to the
bottom or within structure. In Zoom View, the
display is split to show a full range view on the right
and the zoomed view on the left. As the depth
changes, the zoomed view updates automatically to
display a magnified image of the bottom. The Zoom
Preview Box shows where the zoomed view is in
relation to the full range view. The Zoom Level, or
magnification, is displayed in the lower left corner
and can be changed to suit conditions (see Sonar
Settings - X-Press
TM
Menu). Upper and Lower Zoom
Depth Range numbers indicate the depth of the
water which is being viewed.
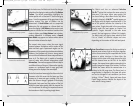
83 kHz Sonar Zoom View shown
with Structure ID® on.
Display showing Fish Arches
Temp/Speed Accessory is optional.
M5565_ManE_531192-1_A.qxd 5/4/2003 9:38 PM Page 14